ASX - SANTOS LIMITED (STO): Elliott Wave Analysis TradingLounge (Daily Chart)

Greetings, Our Elliott Wave analysis today updates the Australian Stock Exchange (ASX) with SANTOS LIMITED (STO) shares. We observe that STO may continue to rise further, with the setup of the third wave within the third wave.

ASX - SANTOS LIMITED (STO) Elliott Wave Technical Analysis

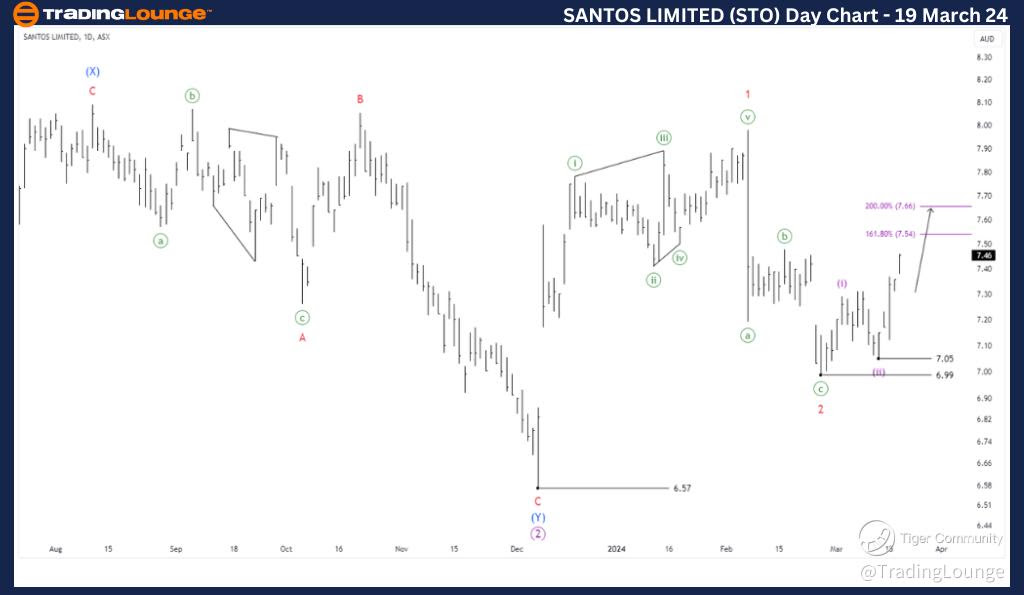
ASX - SANTOS LIMITED (STO): STO 1D Chart Analysis

Function: Major trend (Primary degree, purple)

Mode: Motive

Structure: Impulse  

Position: Wave ((3))-purple

Details: The broader context suggests that waves ((1))-purple and ((2))-purple have concluded, and wave ((3))-purple is now unfolding to move higher. Wave ((2)) appears to have retraced without strong sharpness, despite following a Diagonal, so it's premature to conclude that STO will continue to rise. We will need to continue monitoring, but an upward movement in the medium term is feasible.

Invalidation point: 6.57

SANTOS-LIMITED-Day-A...


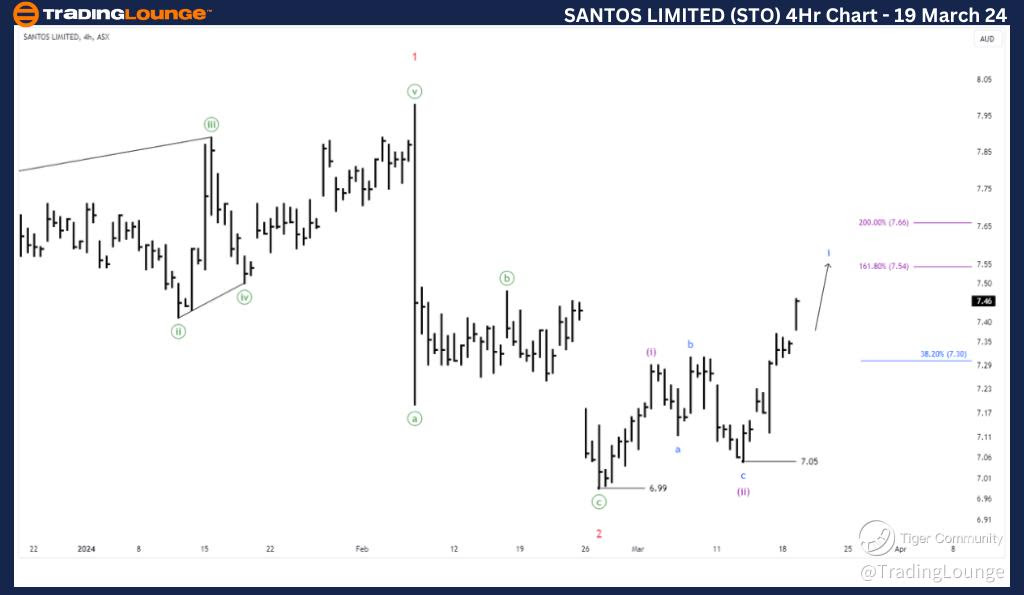
ASX - SANTOS LIMITED (STO): Elliott Wave Analysis TradingLounge (4-Hour Chart),

ASX - SANTOS LIMITED (STO): STO 4-Hour Chart Analysis

Function: Major trend (Minor degree, red)

Mode: Motive

Structure: Impulse

Position: Wave (iii)-purple of Wave 3-red

Details: The shorter-term outlook indicates that waves 1-red and 2-red have concluded, and wave 3-red is now unfolding to move higher. Wave (iii)-purple is expected to continue rising further, with an immediate target at 7.54. A move beyond this high would extend towards 7.66, while prices are expected to maintain levels higher than the low at 7.30.

Invalidation point: 6.99

Conclusion:  

Our analysis and forecast of contextual trends, along with the short-term outlook for ASX: Santos Limited (STO), aim to provide readers with insights into upcoming market trends and how to capitalize on them by identifying optimal positions. Additionally, we offer specific price points that act as invalidation levels for the wave count (acknowledging potential inaccuracies) and confirmation levels to enhance confidence in the wave count. By integrating these elements, we aim to offer readers the most objective and professional perspective and opinion on market trends.

Elliott Wave Analyst: Hua (Shane) Cuong, CEWA-M (Master’s Designation)

Source: visit Tradinglounge.com and learn From the Experts Join TradingLounge Here 

Previous: CSL LIMITED (ASX)

TradingLounge Once Off SPECIAL DEAL: Here > 1 month Get 3 months.

SANTOS-LIMITED-4Hr-A...

Related

Exxon Mobil Corp.(XOM:NYSE) Elliott Wave Technical Analysis 17 October 23

Exxon Mobil Corp.(XOM:NYSE) Elliott Wave Technical Analysis 17 October 23

Exxon Mobil Corp.(XOM:NYSE) Elliott Wave Technical Analysis 17 October 23. TradingLounge Analyst ant...

Read More >
Discover Mahindra & Mahindra Stock Analysis Using Elliott Wave Techniques: Explore Price Tends and Future Predictions

Discover Mahindra & Mahindra Stock Analysis Using Elliott Wave Techniques: Explore Price Tends and Future Predictions

Mahindra & Mahindra stock is showing strong upward momentum, with Elliott Wave analysis suggesting a...

Read More >
Insights on Berkshire Hathaway Inc Stock Trends and Forecasts: BRK.B Stocks Elliott Wave Technical Analysis

Insights on Berkshire Hathaway Inc Stock Trends and Forecasts: BRK.B Stocks Elliott Wave Technical Analysis

This article delves into the Elliott Wave analysis of Berkshire Hathaway Inc. (BRK.B), focusing on d...

Read More >
Pepsico Inc. (PEP) Elliott Wave Analysis: Unveiling Market Trends - February 13, 2024

Pepsico Inc. (PEP) Elliott Wave Analysis: Unveiling Market Trends - February 13, 2024

Explore the Elliott Wave Technical Analysis of Pepsico Inc. (PEP) on both daily and 4-hour charts as...

Read More >
XRP Price Prediction: Elliott Wave Signals Bullish Breakout to $3.88 with Key Fibonacci Zones for Swing Trade Opportunities

XRP Price Prediction: Elliott Wave Signals Bullish Breakout to $3.88 with Key Fibonacci Zones for Swing Trade Opportunities

Analyse XRP's Elliott Wave setup with forecasts showing a bullish breakout to $3.88. Includes Fi...

Read More >
Euro/U.S.Dollar(EURUSD) Elliott Wave Technical Analysis 19 December 23

Euro/U.S.Dollar(EURUSD) Elliott Wave Technical Analysis 19 December 23

The EURUSD Elliott Wave Analysis for the day chart on 19 December 23, suggests an impulsive wave lab...

Read More >

$1 for 2 Weeks

then $29 a month!

What a Special Offer!

Trade Recommendations

Unleash the power of deversified trading with our comprehensive portfolio, covering 250+ markets:

  • Stock Trades
  • Crypto Trades
  • Forex Trades
  • Commodity Trades
Elliott Wave Analysis

Gain a competitive edge with expert insights and AI-powered Elliott Wave charting into:

  • Global Indices
  • US Stocks & ASX Stocks
  • Forex & Crypto
  • Commodities
Top-Notch Trading Tools

Equip yourself with the tools of success:

  • Real-time Chat rooms
  • Elliott Wave Algorithm
  • Portfolio tools
  • TradingLevels
  • Screener
  • Trading Game
7 Elliott Wave Analysts

Stay ahead of the market with daily charts and insightful videos
Your secret to strategic trading!

JOIN HERE


Welcome to TradingLounge (ASIC A.R.No. 321187), specialists in trades, trading education and technical analysis, covering stocks, indices, commodities, forex and cryptocurrencies.

When you join TradingLounge you have access to everything we offer, including trade tools, educational content and a social platform to chat with like-minded investors.

Read more

@Copyright 2024 by tradinglounge.com

Contact Us

Australian no: 02 4787 6020

International no: +61 (2) 47876020

Pay with:

Find us on