TradingLounge CIPLA Stock Elliott Wave Analysis (1D Chart)
CIPLA Stock Day Chart Analysis
CIPLA Elliott Wave Technical Analysis
Function: Larger Degree Trend Higher (Intermediate Degree Orange)
Mode: Motive
Structure: Impulse
Position: Minor Wave 5 Grey
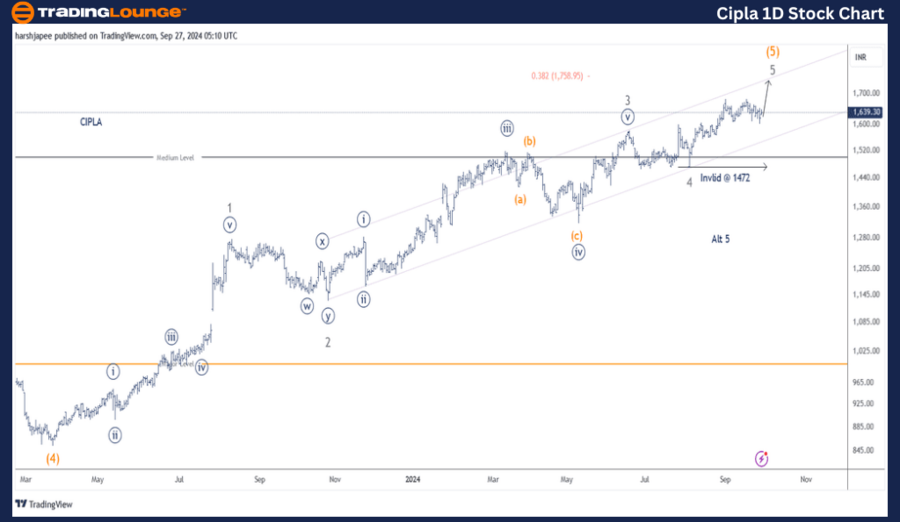
Details: Minor Wave 5 Grey is progressing higher towards 1758, within Intermediate Wave (5) Orange, with support at 1472.
Invalidation point: 1472
CIPLA Daily Chart Technical Analysis and Potential Elliott Wave Counts:
The CIPLA daily chart suggests a continued upward movement towards the 1758-60 zone. This will conclude Minor Wave 5 Grey of Intermediate Wave (5) Orange and mark the end of the uptrend at a larger degree. Once this phase completes, bears are expected to take control, with a confirmed trend reversal if the price breaks below 1470.
CIPLA is nearing the completion of Intermediate Wave (5) Orange, which began after a low around 850-55 was registered in March 2023. Minor Waves 1 through 5 are almost complete, with the final leg expected to reach the 1758 target.
If this scenario plays out, the stock should react near the 1760 level and begin a downward move as bears regain control. A break below 1470-72, marking the termination of Minor Wave 4 Grey, will confirm a trend reversal.
CIPLA – CIPLA 4-Hour Chart Technical Analysis
Function: Larger Degree Trend Higher (Intermediate Degree Orange)
Mode: Motive
Structure: Impulse
Position: Minor Wave 5 Grey
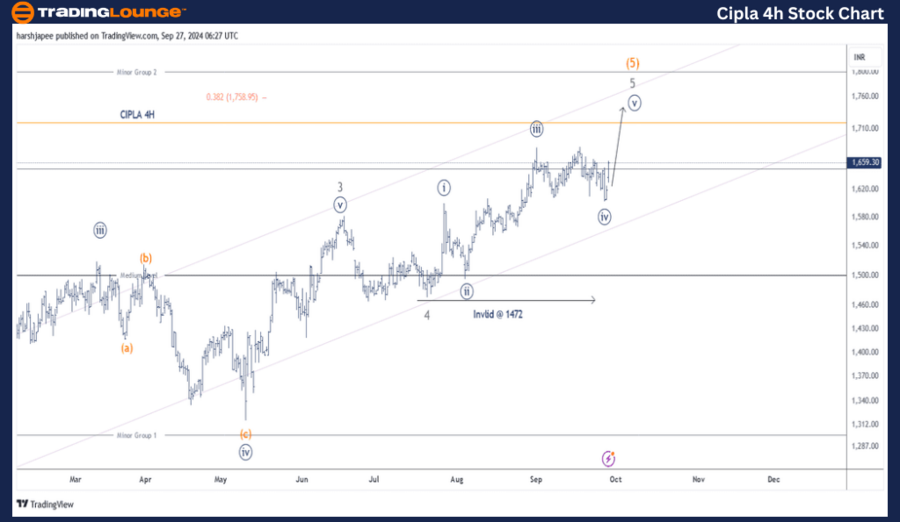
Details: Minor Wave 5 Grey is progressing higher towards 1758, within Intermediate Wave (5) Orange, with support at 1472. Minute Wave ((v)) Grey may now be in progress as bulls attempt one final rally.
Invalidation point: 1472
CIPLA 4H Chart Technical Analysis and Potential Elliott Wave Counts:
The CIPLA 4H chart also indicates that Minute Wave ((v)) Navy of Minor Wave 5 Grey within Intermediate Wave (5) Orange may be underway after Minute Wave ((iv)) ended around the 1600-05 zone. If this projection holds, prices are expected to rise to at least the 1758 level, as suggested by the Fibonacci 0.618 extension.
Technical Analyst: Harsh Japee
Source: visit Tradinglounge.com and learn From the Experts Join TradingLounge Here
Previous: TATA Consumer Product Elliott Wave Technical Analysis
VALUE Offer - Buy 1 Month & Get 3 Months!Click here
Access 7 Analysts Over 200 Markets Covered. Chat Room With Support
Conclusion:
CIPLA is advancing toward the 1758 level as Minor Wave 5 Grey of Intermediate Wave (5) Orange approaches its final phase.