Greetings, Our Elliott Wave analysis today provides an update on the Australian Stock Exchange (ASX), focusing on ANZ Group Holdings Limited - ANZ – WES. We anticipate ANZ moving lower in the near term, showing signs of weakness in the prevailing bull market trend.
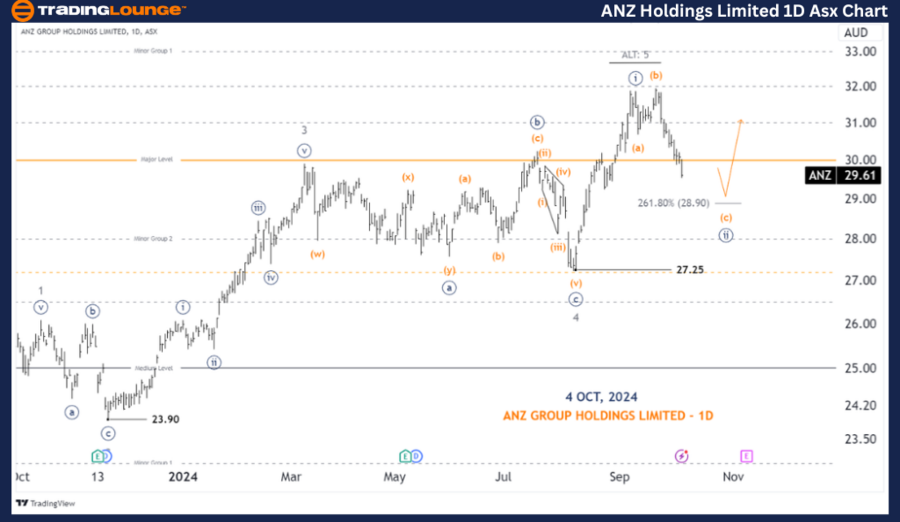
ASX: ANZ Group Holdings Limited - TradingLounge 1D Chart
ANZ – WES 1D Chart (Semilog Scale) Analysis
ANZ Elliott Wave Technical Analysis
Function: Major Trend (Minute degree, navy)
Mode: Motive
Structure: Impulse
Position: Wave (c)-orange of Wave ((ii))-navy of Wave 5-grey
Details: Wave 5-grey is either in the process of unfolding to push higher or may have already ended. In both scenarios, the price is expected to continue downward toward the nearest target at approximately 28.90. If the price breaks below 27.25, it would trigger an alternative scenario (ALT), suggesting that the entire five-wave sequence has completed with wave 5-grey, indicating a major correction is underway, likely pushing prices significantly lower.
Invalidation Point: 27.25

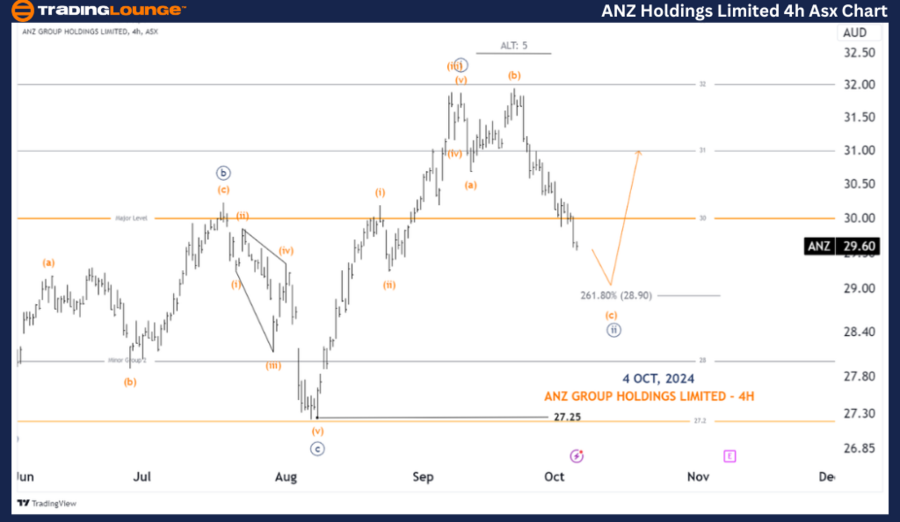
ASX: ANZ Group Holdings Limited - ANZ – WES 4-Hour Chart Analysis
Function: Major Trend (Minute degree, navy)
Mode: Motive
Structure: Impulse
Position: Wave (c)-orange of Wave ((ii))-navy
Details: Wave ((ii))-navy is expected to continue moving lower, forming an Expanded Flat structure. It is targeting a low near 28.90. If this level is breached, further downside movement is likely, with a break below 27.25 signaling that wave 5-grey is indeed complete and a larger downward correction is in play.
Invalidation Point: 27.25
Technical Analyst: Hua (Shane) Cuong, CEWA-M (Master’s Designation).
Source: visit Tradinglounge.com and learn From the Experts Join TradingLounge Here
See Previous: BHP GROUP LIMITED - BHP Elliott Wave Technical Analysis
VALUE Offer - Buy 1 Month & Get 3 Months!Click here
Access 7 Analysts Over 200 Markets Covered. Chat Room With Support

Conclusion:
Our Elliott Wave analysis and forecast for ASX: ANZ Group Holdings Limited - ANZ – WES are designed to provide insight into the current market trends. We identify key price levels that serve as validation or invalidation points for our wave count, helping traders to better assess the market direction. By combining these elements, we aim to offer a clear and professional outlook on the potential market movements and how to act upon them.