19Jun

IBEX 35 (Spain) Elliott Wave Analysis – Daily and Weekly Wave Count for Spanish Stock Market Forecast

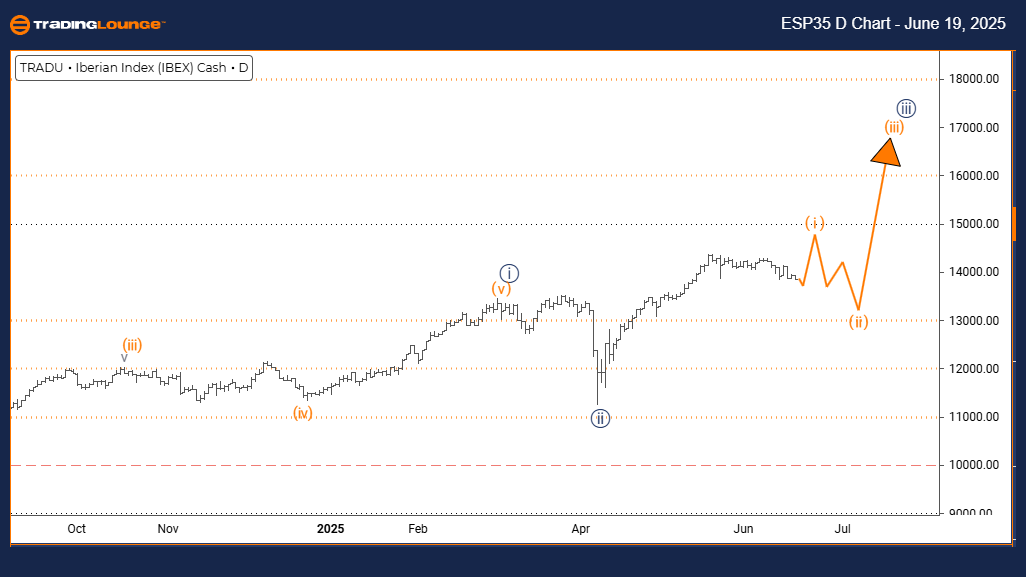
IBEX 35 (Spain) Elliott Wave Analysis – Trading Lounge Day Chart

IBEX 35 (Spain) Wave Technical Analysis

FUNCTION: Bullish Trend

MODE: Impulsive

STRUCTURE: Orange Wave 1

POSITION: Navy Blue Wave 3

DIRECTION NEXT LOWER DEGREES: Orange Wave 2

DETAILS: Navy Blue Wave 2 looks complete. Orange Wave 1 of 3 is unfolding.

The daily Elliott Wave chart for IBEX 35 indicates a strong bullish trend. The current market behavior is impulsive, confirming buyer strength. The ongoing wave structure marks Orange Wave 1 within a broader Navy Blue Wave 3, signaling the initial phase of a sustained upward trend.

As Navy Blue Wave 2 finishes its corrective cycle, Orange Wave 1 of Navy Blue Wave 3 has activated, initiating a fresh bullish leg. The expected next move in the lower degree is Orange Wave 2, which typically follows Wave 1 and may present a short corrective dip before resuming the primary trend.

Overall, the technical setup for IBEX 35 supports further gains. The transition from Navy Blue Wave 2 to Orange Wave 1 suggests renewed buying pressure and higher price potential. The impulsive formation aligns with a bullish outlook, highlighting increased investor interest and short-term upside prospects.

IBEX-d-index-chart-1...


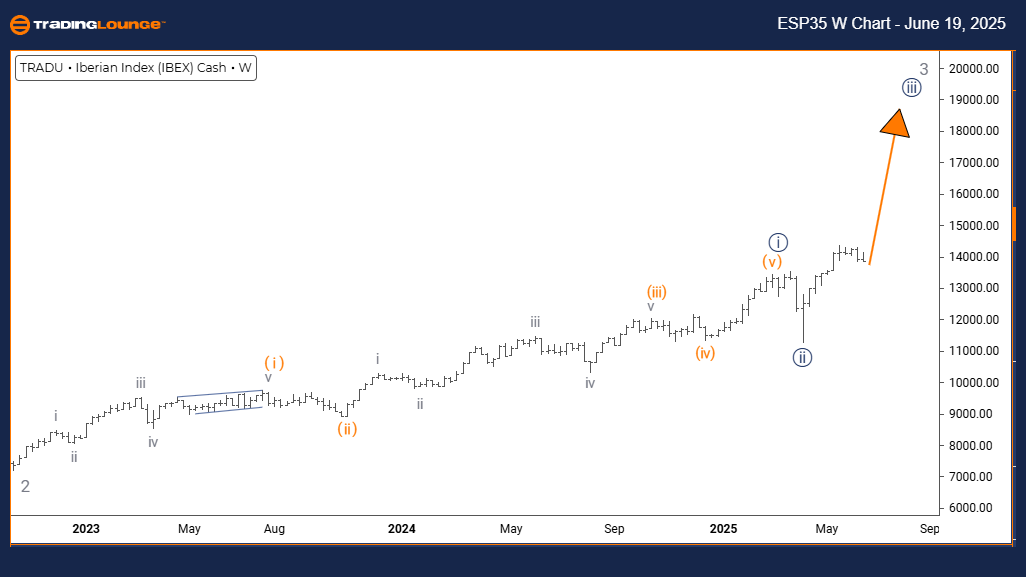
IBEX 35 (Spain) Elliott Wave Analysis – Trading Lounge Weekly Chart

IBEX 35 (Spain) Wave Technical Analysis

FUNCTION: Bullish Trend

MODE: Impulsive

STRUCTURE: Navy Blue Wave 3

POSITION: Gray Wave 3

DIRECTION NEXT LOWER DEGREES: Orange Wave 2

DETAILS: Navy Blue Wave 2 appears complete. Navy Blue Wave 3 is active.

The weekly Elliott Wave forecast for IBEX 35 confirms a strong bullish momentum. The index is progressing within an impulsive Navy Blue Wave 3, part of the broader Gray Wave 3 formation. Third waves typically represent the most dynamic phase of an Elliott Wave sequence.

Following the completion of Navy Blue Wave 2, the market has entered Navy Blue Wave 3, pointing to the start of a sustained advance. This leg often features sharp price gains and minimal retracements. After this phase, Orange Wave 2 is expected to develop at the lower degree.

The broader technical landscape continues to favor IBEX 35 upside potential. With Navy Blue Wave 3 in play, the chart reflects a period of strong institutional support and positive investor sentiment. As it progresses inside Gray Wave 3, the bullish trend is likely to persist over the medium term.

Technical Analyst: Malik Awais

Source: Visit Tradinglounge.com and learn from the Experts. Join TradingLounge Here

Previous: SWISS MARKET Elliott Wave Technical Analysis

VALUE Offer - $1 for 2 Weeks then $29 a month!Click here

Access 7 Analysts Over 200 Markets Covered. Chat Room With Support

IBEX-w-index-chart-1...

Related

Comprehensive British Pound/U.S.Dollar (GBPUSD) Forex Elliott Wave Technical Analysis

Comprehensive British Pound/U.S.Dollar (GBPUSD) Forex Elliott Wave Technical Analysis

Dive into our comprehensive GBPUSD Elliott Wave analysis to understand the future price movements of...

Read More >
PepsiCo Inc. (PEP) Elliott Wave Analysis: Key Support at $150 Signals Potential Wave 3 Rally and Long-Term Bullish Trend Reversal

PepsiCo Inc. (PEP) Elliott Wave Analysis: Key Support at $150 Signals Potential Wave 3 Rally and Long-Term Bullish Trend Reversal

PepsiCo (PEP) is approaching key support at $150, marking a potential bottom in Minor wave 2. A conf...

Read More >
Elliott Wave Trading Strategies for SP500, NASDAQ, Tech Giants & Bitcoin

Elliott Wave Trading Strategies for SP500, NASDAQ, Tech Giants & Bitcoin

The Expanded Wave IV correction for U.S. indices is nearly complete, with expectations of one more l...

Read More >
Unlock Bitcoin's Future: Master BTCUSD Trading with Elliott Wave  Analysis

Unlock Bitcoin's Future: Master BTCUSD Trading with Elliott Wave Analysis

This article provides a detailed Elliott Wave analysis of Bitcoin (BTCUSD), focusing on current mark...

Read More >
Unlocking ASX Trading Success: ANZ GROUP HOLDINGS LIMITED - ANZ Elliott Wave Analysis & Elliott Wave Technical Forecast

Unlocking ASX Trading Success: ANZ GROUP HOLDINGS LIMITED - ANZ Elliott Wave Analysis & Elliott Wave Technical Forecast

This in-depth Elliott Wave analysis focuses on ASX: ANZ GROUP HOLDINGS LIMITED, highlighting key tec...

Read More >
PayPal Holdings Inc. (PYPL) Elliott Wave Analysis: Offering Insights into Stock Forecast, Trends & Stock Support and Resistance

PayPal Holdings Inc. (PYPL) Elliott Wave Analysis: Offering Insights into Stock Forecast, Trends & Stock Support and Resistance

This article provides an Elliott Wave analysis of PayPal Holdings Inc. (PYPL), detailing the current...

Read More >

$1 for 2 Weeks

then $29 a month!

What a Special Offer!

Trade Recommendations

Unleash the power of deversified trading with our comprehensive portfolio, covering 250+ markets:

  • Stock Trades
  • Crypto Trades
  • Forex Trades
  • Commodity Trades
Elliott Wave Analysis

Gain a competitive edge with expert insights and AI-powered Elliott Wave charting into:

  • Global Indices
  • US Stocks & ASX Stocks
  • Forex & Crypto
  • Commodities
Top-Notch Trading Tools

Equip yourself with the tools of success:

  • Real-time Chat rooms
  • Elliott Wave Algorithm
  • Portfolio tools
  • TradingLevels
  • Screener
  • Trading Game
7 Elliott Wave Analysts

Stay ahead of the market with daily charts and insightful videos
Your secret to strategic trading!

JOIN HERE


Welcome to TradingLounge (ASIC A.R.No. 321187), specialists in trades, trading education and technical analysis, covering stocks, indices, commodities, forex and cryptocurrencies.

When you join TradingLounge you have access to everything we offer, including trade tools, educational content and a social platform to chat with like-minded investors.

Read more

@Copyright 2024 by tradinglounge.com

Contact Us

Australian no: 02 4787 6020

International no: +61 (2) 47876020

Pay with:

Find us on