13Feb

Gold (XAUUSD) Elliott Wave Technical Analysis Insights for February 13, 2024

Gold Elliott Wave Analysis: Understanding Counter-trend Movements, February 13, 2024

Gold (XAUUSD) Elliott Wave Analysis

Gold's Elliott Wave analysis reveals intriguing insights into its current trajectory, suggesting a corrective phase characterized by a triangle structure.
As we delve into the details provided by technical analyst Sanmi Adeagbot, we uncover potential scenarios and crucial levels to watch, all aimed at guiding informed trading decisions.

Function: Counter-trend Gold's current Elliott Wave pattern indicates a counter-trend movement, signaling a temporary deviation from the prevailing market direction. Traders keen on exploiting short-term opportunities amidst broader trends should pay close attention to this corrective phase.

Mode: Corrective Within the Elliott Wave framework, Gold's movement is categorized as corrective, implying a temporary pause or reversal within the larger price trend. Recognizing this corrective mode is vital for traders seeking to capitalize on short-term fluctuations in Gold's price.

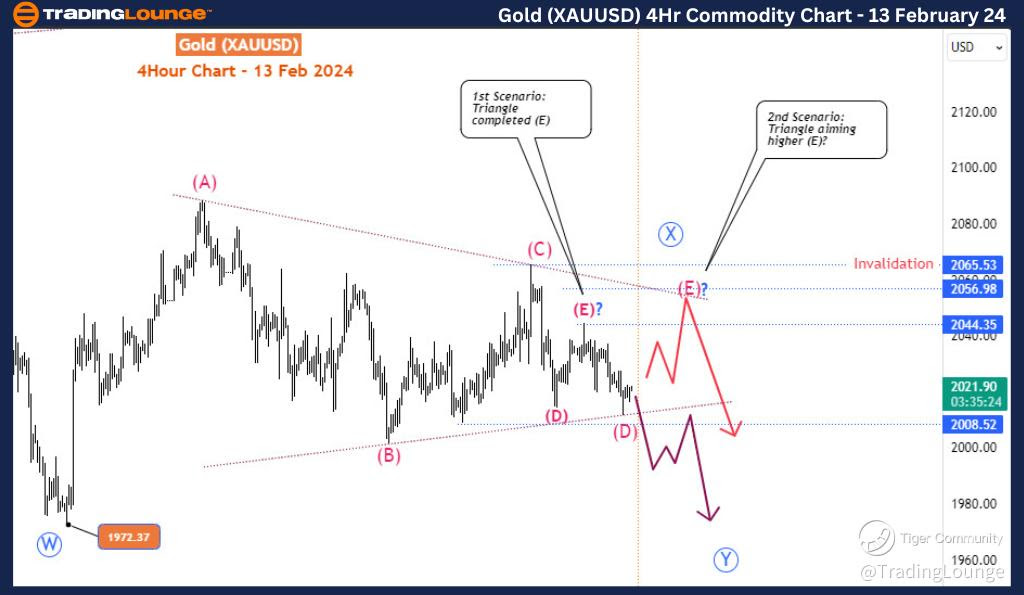
Structure: Triangle The structure of Gold's Elliott Wave pattern resembles a triangle, characterized by converging trend lines that signify diminishing volatility and indecision in the market. Traders must monitor this triangular formation closely as it often precedes significant price movements.

Position: Blue Wave X of larger degree red wave IV Gold's current position within the Elliott Wave sequence is identified as the Blue Wave X of a larger degree red wave IV. This positioning provides crucial context for understanding the broader market dynamics and potential future price movements.

Direction: Blue wave Y of larger degree red wave IV The imminent direction for Gold is the Blue Wave Y of the larger degree red wave IV. Traders should anticipate the unfolding of this wave to gauge potential trading opportunities and adjust their strategies accordingly.

Key Details: Wave E of the triangle may have been completed, or there's a possibility of one more rally into the 2051-2057 supply zone. A breakdown below 2008 would confirm the initiation of the blue wave Y, potentially driving prices towards the 1985-1975 key zone. Conversely, a surge above 2044 suggests the wave (E) might correct higher into the mentioned supply zone. It's crucial to note that the entire Triangle structure becomes invalidated above 2065.

Technical Analyst: Sanmi Adeagbot 

Source: visit Tradinglounge.com and learn From the Experts Join TradingLounge Here 

See Previous: Natural Gas

Gold-XAUUSD-Commodit...

Related

Stay informed on BPCL’s Stock Performance and Trading Strategies: BPCL Stock Elliott Wave Technical Analysis

Stay informed on BPCL’s Stock Performance and Trading Strategies: BPCL Stock Elliott Wave Technical Analysis

Discover in-depth BPCL share price analysis through Elliott Wave technical analysis. This detailed f...

Read More >
ANZ stock performance with Technical Analysis and Price Targets: Elliott Wave Analysis for ANZ Group Holdings Limited

ANZ stock performance with Technical Analysis and Price Targets: Elliott Wave Analysis for ANZ Group Holdings Limited

Our comprehensive Elliott Wave analysis for ANZ Group Holdings Limited on the Australian Stock Excha...

Read More >
Deere & Co. (DE) Stocks Elliott Wave Technical Analysis: Bullish Trends, and Actionable Insights into Potential Price Movements

Deere & Co. (DE) Stocks Elliott Wave Technical Analysis: Bullish Trends, and Actionable Insights into Potential Price Movements

This comprehensive Elliott Wave analysis for Deere & Co (DE) covers daily and 1-hour chart structure...

Read More >
New Zealand Dollar/U.S.Dollar (NZDUSD) Elliott Wave Technical Analysis 7 December 23

New Zealand Dollar/U.S.Dollar (NZDUSD) Elliott Wave Technical Analysis 7 December 23

NZDUSD Elliott Wave Analysis Trading Lounge Day Chart dated 7 December 23, provides a comprehensive ...

Read More >
AbbVie Inc. (ABBV) Stocks Elliott Wave Technical Analysis: Detailed Forecast & Price Prediction

AbbVie Inc. (ABBV) Stocks Elliott Wave Technical Analysis: Detailed Forecast & Price Prediction

Explore our comprehensive ABBV stock analysis featuring Elliott Wave theory to forecast AbbVie Inc.&...

Read More >

$1 for 2 Weeks

then $29 a month!

What a Special Offer!

Trade Recommendations

Unleash the power of deversified trading with our comprehensive portfolio, covering 250+ markets:

  • Stock Trades
  • Crypto Trades
  • Forex Trades
  • Commodity Trades
Elliott Wave Analysis

Gain a competitive edge with expert insights and AI-powered Elliott Wave charting into:

  • Global Indices
  • US Stocks & ASX Stocks
  • Forex & Crypto
  • Commodities
Top-Notch Trading Tools

Equip yourself with the tools of success:

  • Real-time Chat rooms
  • Elliott Wave Algorithm
  • Portfolio tools
  • TradingLevels
  • Screener
  • Trading Game
7 Elliott Wave Analysts

Stay ahead of the market with daily charts and insightful videos
Your secret to strategic trading!

JOIN HERE


Welcome to TradingLounge (ASIC A.R.No. 321187), specialists in trades, trading education and technical analysis, covering stocks, indices, commodities, forex and cryptocurrencies.

When you join TradingLounge you have access to everything we offer, including trade tools, educational content and a social platform to chat with like-minded investors.

Read more

@Copyright 2024 by tradinglounge.com

Contact Us

Australian no: 02 4787 6020

International no: +61 (2) 47876020

Pay with:

Find us on