18Jun

Swiss Market Elliott Wave Analysis Shows SMI Correction Phase Ending and Bullish Trend Forming on Daily and Weekly Charts

SWISS MARKET INDEX Elliott Wave Analysis | Trading Lounge Day Chart

SWISS MARKET INDEX Wave Technical Analysis

FUNCTION: Counter-Trend

MODE: Corrective

STRUCTURE: Orange Wave 2

POSITION: Navy Blue Wave 1

DIRECTION NEXT HIGHER DEGREES: Orange Wave 3

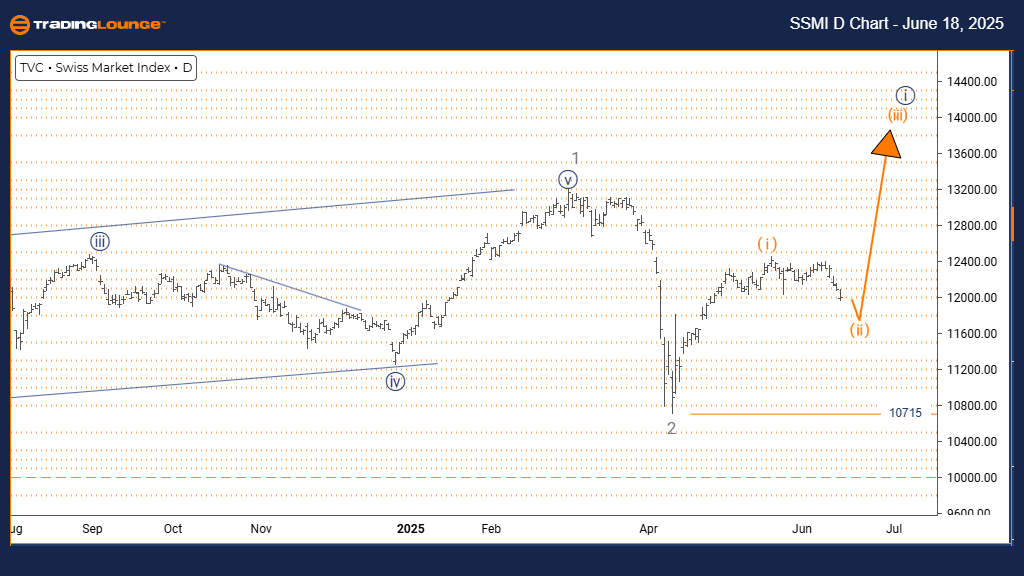
DETAILS: Orange Wave 1 appears completed; Orange Wave 2 is currently active.

Wave Cancel Invalid Level: 10715

The SWISS MARKET INDEX (SMI) daily chart shows a corrective pattern within a counter-trend setup. Price activity signals a retracement forming as part of the larger bullish structure. The development of Orange Wave 2 under Navy Blue Wave 1 suggests a short-term pullback within a longer uptrend.

With Orange Wave 1 likely completed, the market now enters the Orange Wave 2 phase. Typically, this wave corrects a portion of the prior advance before giving way to Orange Wave 3—expected to continue the primary bullish trend.

Currently, SMI is progressing through Orange Wave 2. This correction may include sideway moves or minor declines. The key support level remains at 10715; a break below this point would invalidate the existing wave count. Until that occurs, the technical structure supports a brief corrective period followed by a bullish continuation.

SWISS-MARKET-d-index...


SWISS MARKET INDEX Elliott Wave Analysis | Trading Lounge Weekly Chart

SWISS MARKET INDEX Wave Technical Analysis

FUNCTION: Bullish Trend

MODE: Impulsive

STRUCTURE: Navy Blue Wave 1

POSITION: Gray Wave 3

DIRECTION NEXT LOWER DEGREES: Navy Blue Wave 2

DETAILS: Gray Wave 2 appears completed; Navy Blue Wave 1 of 3 is forming.

Wave Cancel Invalid Level: 10715

The SWISS MARKET INDEX weekly chart indicates a strong bullish trend. After completing Gray Wave 2, the index has initiated Navy Blue Wave 1 of Gray Wave 3—signaling the beginning of a larger impulsive wave sequence.

Within this phase, Orange Wave 2 is unfolding as a corrective segment of Navy Blue Wave 1. This typically includes limited downside or sideways price action. The 10715 level is vital for maintaining this bullish interpretation. A drop below this level would challenge the wave count.

Upon finishing Orange Wave 2, the next leg—Orange Wave 3—is expected to start. Historically, Wave 3 is the most powerful phase in an Elliott Wave cycle. Traders should monitor the market for signs of Wave 2 conclusion to capture the potential surge in Wave 3.

Despite the current consolidation, the long-term outlook remains positive. As long as 10715 holds, the bullish structure remains intact, and further upward momentum is anticipated.

Technical Analyst: Malik Awais

Source: Visit Tradinglounge.com and learn from the Experts. Join TradingLounge Here

Previous: Shanghai Composite Elliott Wave Technical Analysis

VALUE Offer - $1 for 2 Weeks then $29 a month!Click here

Access 7 Analysts Over 200 Markets Covered. Chat Room With Support

SWISS-MARKET-w-index...

Related

Elliott Wave Analysis for NASDAQ 100 & Tech Stocks: Insights & Strategies for NDX, SP500, and Major Companies

Elliott Wave Analysis for NASDAQ 100 & Tech Stocks: Insights & Strategies for NDX, SP500, and Major Companies

This summary provides a comprehensive Elliott Wave analysis of the NASDAQ 100 (NDX) and major techno...

Read More >
Currency Pair New Zealand Dollar/U.S.Dollar (NZDUSD) Forex Elliott Wave Technical Analysis

Currency Pair New Zealand Dollar/U.S.Dollar (NZDUSD) Forex Elliott Wave Technical Analysis

Discover the secrets to successful NZDUSD trading with our detailed Elliott Wave analysis. Dive into...

Read More >
ChainLink Crypto Price News Today: Elliott Wave Forecast & Effective Trading Strategies

ChainLink Crypto Price News Today: Elliott Wave Forecast & Effective Trading Strategies

This article provides a thorough analysis of ChainLink (LINKUSD) using Elliott Wave principles. It c...

Read More >
ASX FPH Stock Analysis: Fisher & Paykel Healthcare Elliott Wave Forecast, Wave 4 Triangle Pattern, and Price Prediction Insights

ASX FPH Stock Analysis: Fisher & Paykel Healthcare Elliott Wave Forecast, Wave 4 Triangle Pattern, and Price Prediction Insights

Elliott Wave analysis for ASX: FPH (Fisher & Paykel Healthcare Corporation Limited). Our technical a...

Read More >
ASX:IAG Elliott Wave Analysis, Stock Forecast, Price Trends, Wave Patterns, Market Insights, and Trading Strategies for Investors

ASX:IAG Elliott Wave Analysis, Stock Forecast, Price Trends, Wave Patterns, Market Insights, and Trading Strategies for Investors

Get the latest ASX:IAG Elliott Wave analysis and stock forecast. Learn how wave patterns influence I...

Read More >

$1 for 2 Weeks

then $29 a month!

What a Special Offer!

Trade Recommendations

Unleash the power of deversified trading with our comprehensive portfolio, covering 250+ markets:

  • Stock Trades
  • Crypto Trades
  • Forex Trades
  • Commodity Trades
Elliott Wave Analysis

Gain a competitive edge with expert insights and AI-powered Elliott Wave charting into:

  • Global Indices
  • US Stocks & ASX Stocks
  • Forex & Crypto
  • Commodities
Top-Notch Trading Tools

Equip yourself with the tools of success:

  • Real-time Chat rooms
  • Elliott Wave Algorithm
  • Portfolio tools
  • TradingLevels
  • Screener
  • Trading Game
7 Elliott Wave Analysts

Stay ahead of the market with daily charts and insightful videos
Your secret to strategic trading!

JOIN HERE


Welcome to TradingLounge (ASIC A.R.No. 321187), specialists in trades, trading education and technical analysis, covering stocks, indices, commodities, forex and cryptocurrencies.

When you join TradingLounge you have access to everything we offer, including trade tools, educational content and a social platform to chat with like-minded investors.

Read more

@Copyright 2024 by tradinglounge.com

Contact Us

Australian no: 02 4787 6020

International no: +61 (2) 47876020

Pay with:

Find us on