16Jun

ADANI ENTERPRISES - ADANIENT Elliott Wave Correction Set-Up Ahead of Bullish Orange Wave 3 Technical Breakout Guidance

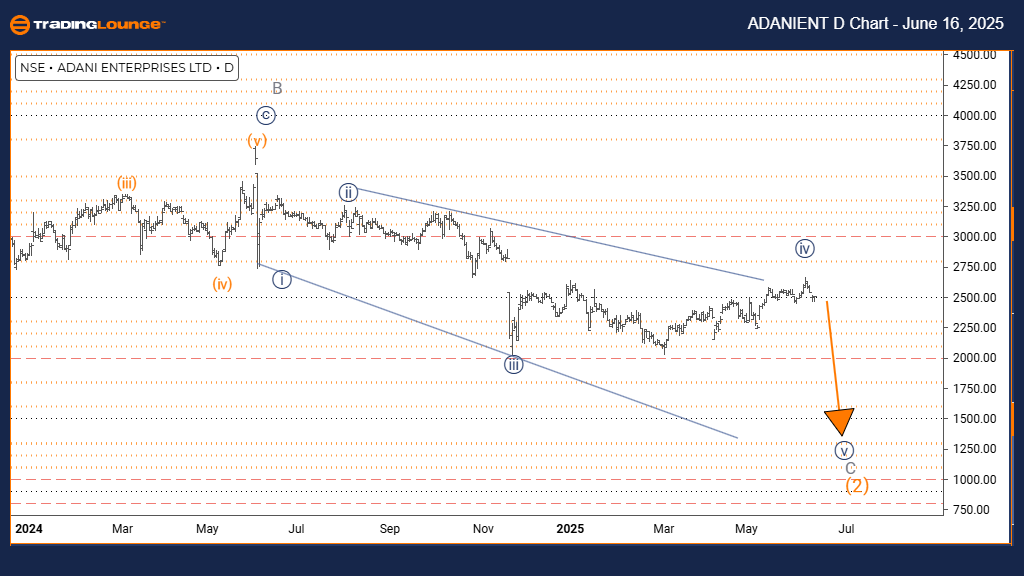
ADANI ENTERPRISES Elliott Wave Analysis | Trading Lounge Day Chart

ADANI ENTERPRISES Elliott Wave Technical Analysis

FUNCTION: Counter-Trend

MODE: Impulsive

STRUCTURE: Gray Wave C

POSITION: Orange Wave 2

NEXT DIRECTION (HIGHER DEGREES): Orange Wave 3

DETAILS: Gray Wave B appears to have completed, with Gray Wave C currently in development.

The Elliott Wave daily analysis for ADANI ENTERPRISES stock highlights a counter-trend phase, marked by an impulsive movement that goes against the prevailing trend. The current wave count identifies Gray Wave C, forming within the broader corrective pattern known as Orange Wave 2. This setup indicates that the correction may be in its final leg.

Following the completion of Gray Wave B, the market has shifted into Gray Wave C, which is traditionally the final component of a corrective wave sequence. This wave often demonstrates strong counter-trend momentum. Once Gray Wave C concludes, the next anticipated movement is Orange Wave 3, potentially signaling a return to the long-term bullish trend.

At this moment, ADANI ENTERPRISES appears to be progressing through Gray Wave C. The impulsive wave nature suggests continued downside momentum. Traders should monitor for any signs that point to the end of this wave, as that would indicate the conclusion of Orange Wave 2.

Given its counter-trend classification, additional bearish activity may persist until the current wave structure completes. Investors should focus on potential reversal patterns that may confirm the end of Gray Wave C and herald the beginning of Orange Wave 3.

ADANIENT-d-indian-ch...


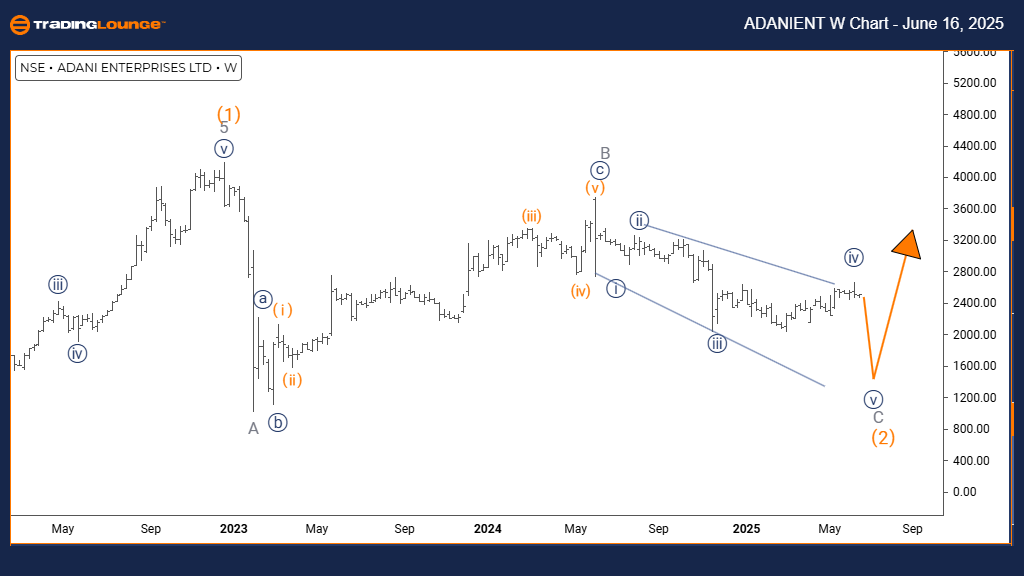
ADANI ENTERPRISES Elliott Wave Analysis | Trading Lounge Weekly Chart

ADANI ENTERPRISES Elliott Wave Technical Analysis

FUNCTION: Counter-Trend

MODE: Impulsive

STRUCTURE: Gray Wave C

POSITION: Orange Wave 2

NEXT DIRECTION (HIGHER DEGREES): Orange Wave 3

DETAILS: Gray Wave B appears completed; Gray Wave C is now in progress.

The weekly Elliott Wave outlook for ADANI ENTERPRISES reflects a counter-trend setup, currently exhibiting impulsive characteristics that suggest strong selling momentum. The wave count outlines Gray Wave C as part of the extended corrective Orange Wave 2 formation, indicating a nearing end to this market phase.

With Gray Wave B seemingly complete, focus now turns to Gray Wave C, which typically represents the final leg of corrective structures. This wave usually moves sharply in the direction opposite to the primary trend. The expected follow-up to this sequence is Orange Wave 3, which could reignite the primary bullish trend.

At this juncture, ADANI ENTERPRISES appears to be nearing the conclusion of its counter-trend move, with Gray Wave C actively shaping. The impulsive wave structure implies pronounced bearish sentiment. Traders should look for reversal signals, which may suggest the wrap-up of Orange Wave 2 and a shift towards upward momentum.

Until Gray Wave C finishes, additional downside pressure is anticipated. Market participants are advised to watch this wave’s development closely to identify any potential entry points aligned with the forthcoming Orange Wave 3 rally.

Technical Analyst: Malik Awais

Source: Visit Tradinglounge.com and learn from the Experts. Join TradingLounge Here 

Previous: ADANI GREEN Elliott Wave Technical Analysis

VALUE Offer - $1 for 2 Weeks then $29 a month!Click here

Access 7 Analysts Over 200 Markets Covered. Chat Room With Support

ADANIENT-w-indian-ch...

Related

Bitcoin/U.S. dollar(BTCUSD) Elliott Wave Technical Analysis 17 October 23

Bitcoin/U.S. dollar(BTCUSD) Elliott Wave Technical Analysis 17 October 23

Trading lounge Bitcoin/U.S. dollar(BTCUSD) Elliott Wave Technical Analysis 4-hour and day charts for...

Read More >
 Insightful Trading Strategies Unveiled: U.S.Dollar/Japanese Yen (USDJPY) Elliott Wave Technical Analysis

Insightful Trading Strategies Unveiled: U.S.Dollar/Japanese Yen (USDJPY) Elliott Wave Technical Analysis

The intricacies of USDJPY Elliott Wave Analysis through our comprehensive insights tailored for trad...

Read More >
Detailed Elliott Wave Analysis of ASX Sonic Healthcare Limited (SHL) with Stock Forecasts, Price Targets, and Market Predictions

Detailed Elliott Wave Analysis of ASX Sonic Healthcare Limited (SHL) with Stock Forecasts, Price Targets, and Market Predictions

This detailed Elliott Wave analysis of ASX Sonic Healthcare Limited (SHL) provides insights into the...

Read More >
ASIAN PAINT Elliott Wave Analysis Forecast: Daily and Weekly Charts Reveal Strong Upside Potential ahead, Investment Setup

ASIAN PAINT Elliott Wave Analysis Forecast: Daily and Weekly Charts Reveal Strong Upside Potential ahead, Investment Setup

ASIAN PAINT stock is forming a new bullish cycle based on Elliott Wave analysis. Daily and weekly ch...

Read More >
MercadoLibre Inc. (MELI) Elliott Wave Analysis Shows Bullish Reversal Setup in Wave (2) With Key Support and Trade Signals

MercadoLibre Inc. (MELI) Elliott Wave Analysis Shows Bullish Reversal Setup in Wave (2) With Key Support and Trade Signals

Elliott Wave breakdown of MercadoLibre Inc. (MELI) explores both daily and intraday charts, indicati...

Read More >
Mastering U.S.Dollar/Japanese Yen (USDJPY) Elliott Wave Analysis: Unveils Key Insights and Trading Strategies

Mastering U.S.Dollar/Japanese Yen (USDJPY) Elliott Wave Analysis: Unveils Key Insights and Trading Strategies

Our USDJPY Elliott Wave Analysis provides traders with invaluable insights for navigating the forex ...

Read More >

$1 for 2 Weeks

then $29 a month!

What a Special Offer!

Trade Recommendations

Unleash the power of deversified trading with our comprehensive portfolio, covering 250+ markets:

  • Stock Trades
  • Crypto Trades
  • Forex Trades
  • Commodity Trades
Elliott Wave Analysis

Gain a competitive edge with expert insights and AI-powered Elliott Wave charting into:

  • Global Indices
  • US Stocks & ASX Stocks
  • Forex & Crypto
  • Commodities
Top-Notch Trading Tools

Equip yourself with the tools of success:

  • Real-time Chat rooms
  • Elliott Wave Algorithm
  • Portfolio tools
  • TradingLevels
  • Screener
  • Trading Game
7 Elliott Wave Analysts

Stay ahead of the market with daily charts and insightful videos
Your secret to strategic trading!

JOIN HERE


Welcome to TradingLounge (ASIC A.R.No. 321187), specialists in trades, trading education and technical analysis, covering stocks, indices, commodities, forex and cryptocurrencies.

When you join TradingLounge you have access to everything we offer, including trade tools, educational content and a social platform to chat with like-minded investors.

Read more

@Copyright 2024 by tradinglounge.com

Contact Us

Australian no: 02 4787 6020

International no: +61 (2) 47876020

Pay with:

Find us on