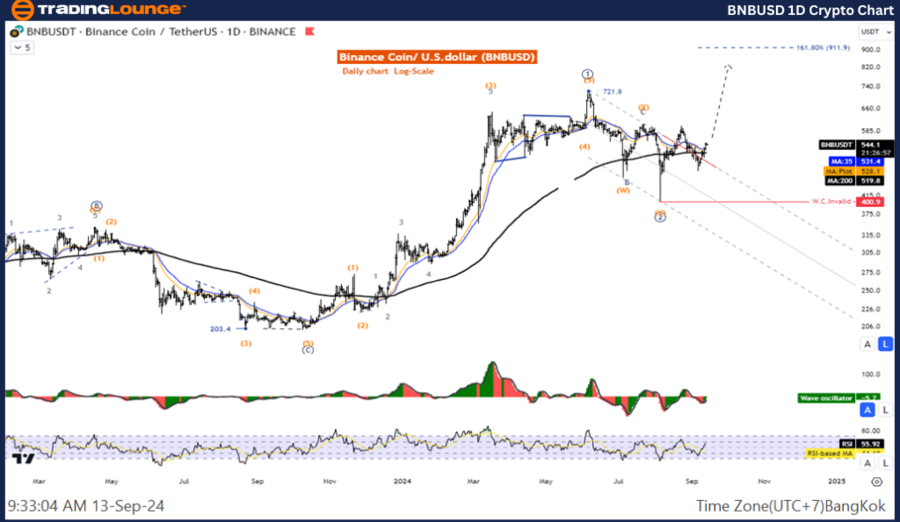
BNBUSD Elliott Wave Analysis - TradingLounge Daily Chart
Binance / U.S. dollar (BNBUSD)
BNBUSD Elliott Wave Technical Analysis
Function: Counter Trend
Mode: Corrective
Structure: Double Corrective
Position: Wave ((Y))
Direction (Next Higher Degree): Wave 2
Wave Cancel Invalid Level:
Details: The decline of Wave Y appears to be nearing its end, signaling a potential re-entry into the uptrend.
BNBUSD Trading Strategy (Daily Chart)
It seems that the Wave 2 correction is complete, and the price is poised for an upward move. Look for potential opportunities to join the Wave 2 uptrend.
BNBUSD Technical Indicators (Daily Chart)
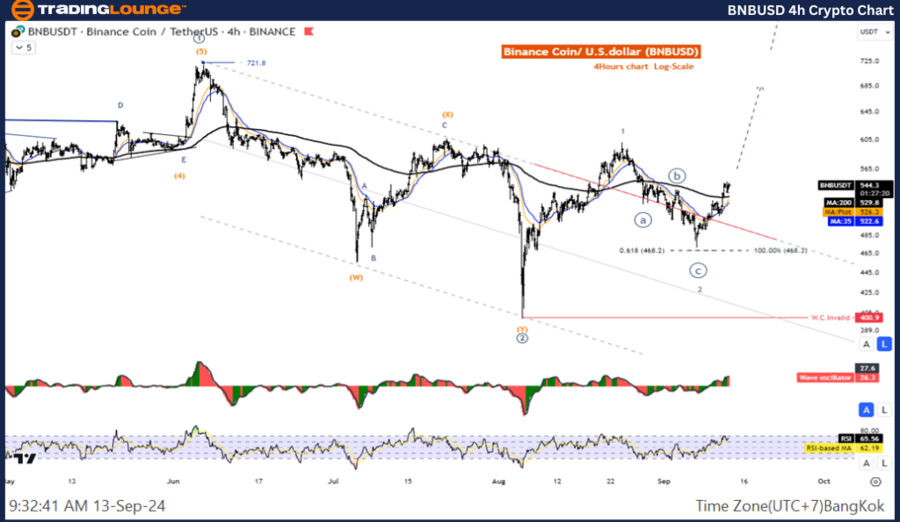
BNBUSD Elliott Wave Analysis - TradingLounge H4 Chart
Binance / U.S. dollar (BNBUSD)
BNBUSD Elliott Wave Technical Analysis
Function: Counter Trend
Mode: Corrective
Structure: Zigzag
Position: Wave C
Direction (Next Higher Degree): Wave (2)
Wave Cancel Invalid Level:
Details: Wave (2) looks close to completion, with the price likely to resume its uptrend.
BNBUSD Trading Strategy (H4 Chart)
The Wave 2 correction seems complete, and the price is expected to continue moving upward. Consider joining the Wave 3 uptrend for potential gains.
BNBUSD Technical Indicators (H4 Chart)
- The price is trading above the MA200, indicating an uptrend.
- The Wave Oscillator shows bearish momentum.
Technical Analyst: Kittiampon Somboonsod
Source: visit Tradinglounge.com and learn From the Experts Join TradingLounge Here
See Previous: NEO / U.S. Dollar (NEOUSD) Elliott Wave Technical Analysis
Special Trial Offer - 0.76 Cents a Day for 3 Months! Click here
Access 7 Analysts Over 200 Markets Covered. Chat Room With Support