Elliott Wave Analysis of TRX/USD (Tron/U.S. Dollar): Daily Charts Insight

TRXUSD Charts Analysis

TRXUSD Elliott Wave Technical Analysis Overview

  • Function: Follow trend

  • Mode: Motive

  • Structure: Impulse

  • Position: Wave ((3))

  • Direction of Next Higher Degrees: Wave V of Impulse

  • Wave Cancellation Invalid Level: 0.1051

  • Details: Notable five-wave increase of Wave ((3))

TRON/USD (TRXUSD) Trading Strategy

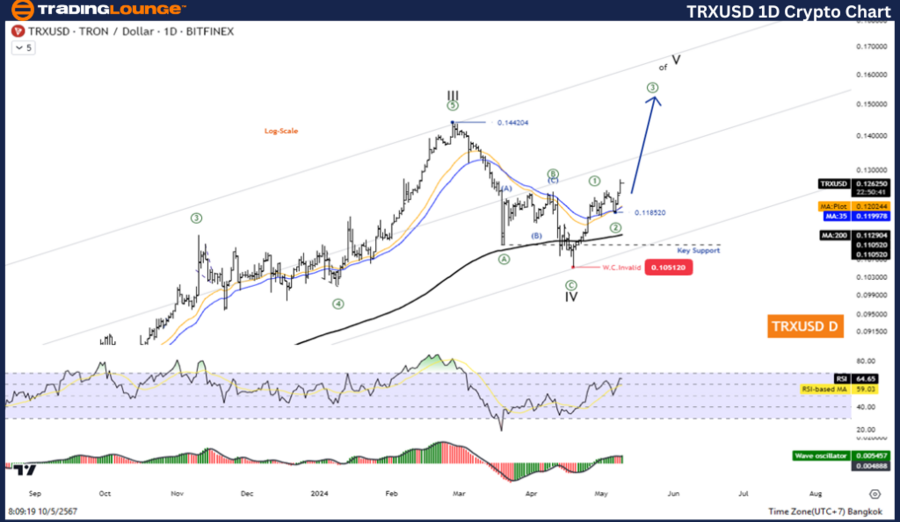
The TRXUSD pair exhibits a clear motive phase within its Elliott Wave pattern, particularly noticeable in the daily and H4 charts. Currently, the price trajectory of TRXUSD follows an impressive impulse pattern marked by a robust third wave—Wave ((3)). This wave is a critical phase in the Elliott Wave structure, known for its strong and often longest rally.

Current Market Position: The third wave, Wave ((3)), is underway, with the first two waves, ((1)) and ((2)), already completed. As the price progresses within this wave, it appears poised for a continued rise, potentially breaching the previous resistance level of 0.1442. This anticipation is supported by the strong momentum and wave structure observed.

Technical Indicators and Market Sentiment

  • Moving Averages: TRXUSD is trading above the 200-day moving average (MA200), a bullish indicator that suggests a strong uptrend.
  • Wave Oscillator: Bullish momentum is confirmed by the Wave Oscillator, reinforcing the positive outlook.

TRXUSD-1D-crypto-cha...


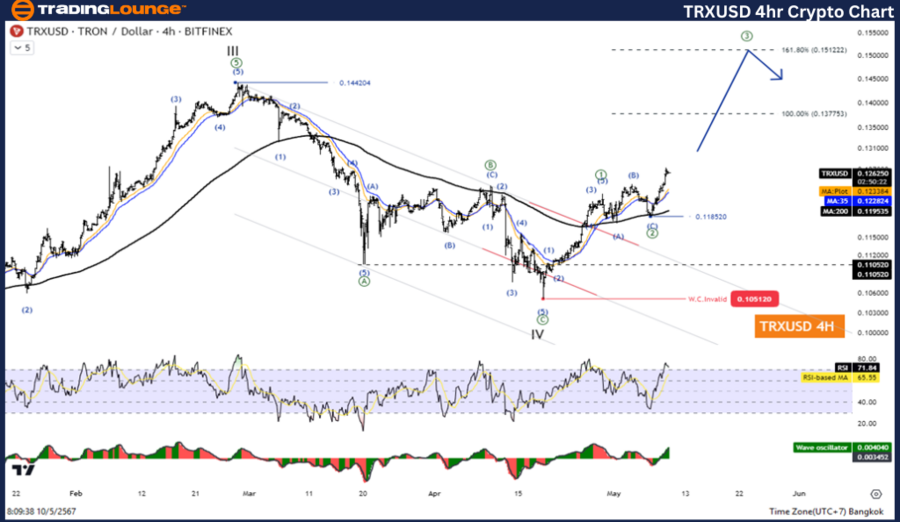
Elliott Wave Analysis of TRX/USD (Tron/U.S. Dollar): H4 Chart Specifics

TRXUSD Elliott Wave Technical Analysis Specifics

  • Function: Follow the trend

  • Mode: Motive

  • Structure: Impulse

  • Position: Wave ((3))

  • Direction of Next Higher Degrees: Wave V of Impulse

  • Wave Cancellation Invalid Level: 0.1051

  • Details: Continuous five-wave increase of Wave ((3))

TRON/USD (TRXUSD) H4 Trading Strategy

Parallel to the insights from the daily chart, the H4 chart underscores the ongoing development of Wave ((3)), integral to the motive phase. The same robust impulse pattern is evident, with the market dynamics favouring further upward movement. This detailed view supports the daily chart’s forecast, offering consistent data across timeframes.

Strategic Trading Considerations: Investors and traders should monitor the 0.1442 level closely, as surpassing this could open the path to higher valuations, especially as the fifth wave within the impulse unfolds. Risk management is crucial, especially around the wave cancellation level of 0.1051, which, if breached, may invalidate the current bullish forecast.

Overall Market Outlook

The Elliott Wave analysis for TRXUSD on both the daily and H4 charts suggests a bullish trend with a strong motive wave in progress. This analysis not only aids traders in anticipating future price movements but also aligns with technical indicators that confirm the ongoing upward momentum. The consistency across different timeframes adds a layer of reliability to this optimistic outlook, making TRXUSD a compelling watch for those following Elliott Wave principles in cryptocurrency markets.

Key Takeaways:

  • Watch for the Continuation of Wave ((3)): The ongoing development in this wave is pivotal for the next price movement.
  • Monitor Key Levels: The 0.1442 resistance and 0.1051 wave cancellation levels are critical markers for future trading decisions.
  • Leverage Technical Indicators: The position above MA200 and positive momentum from the Wave Oscillator provide additional support for the bullish scenario.

By maintaining close observation of these dynamics, traders can strategically position themselves to capitalize on the anticipated upward trajectories in the TRXUSD market.

Technical Analyst: Kittiampon Somboonsod

Source: visit Tradinglounge.com and learn From the Experts Join TradingLounge Here 

See Previous: Bitcoin Crypto Price News Today Elliott Wave Technical Analysis

Special Trial Offer - 0.76 Cents a Day for 3 Months! Click here

Access 7 Analysts Over 170 Markets Covered. Chat Room With Support

TRXUSD-4h-crypto-cha...

Related

Insurance Australia Group IAG Elliott Wave Analysis Reveals Key Resistance Targets Before Major Decline | ASX Stock Forecast

Insurance Australia Group IAG Elliott Wave Analysis Reveals Key Resistance Targets Before Major Decline | ASX Stock Forecast

Insurance Australia Group (ASX:IAG) is completing a B-wave and setting up for a decline. Forecasts s...

Read More >
Silver (XAGUSD) Elliott Wave Insight: In-Depth Technical Analysis & Future Price Forecast For Commodity Investors and Traders

Silver (XAGUSD) Elliott Wave Insight: In-Depth Technical Analysis & Future Price Forecast For Commodity Investors and Traders

This analysis uses Elliott wave theory to examine silver’s recent price action and explore potentia...

Read More >
Stay informed on BPCL’s Stock Performance and Trading Strategies: BPCL Stock Elliott Wave Technical Analysis

Stay informed on BPCL’s Stock Performance and Trading Strategies: BPCL Stock Elliott Wave Technical Analysis

Discover in-depth BPCL share price analysis through Elliott Wave technical analysis. This detailed f...

Read More >
GX Uranium Commodity Elliott Wave Technical Analysis: ETF's Price Trends, Long-term Forecast, and Key Buy Signals

GX Uranium Commodity Elliott Wave Technical Analysis: ETF's Price Trends, Long-term Forecast, and Key Buy Signals

The GX Uranium ETF offers investors a unique opportunity in the uranium sector, supported by rising ...

Read More >
Bharat Electronics Stocks technical insights, price targets, and potential trend movements: BEL Elliott Wave Technical Analysis

Bharat Electronics Stocks technical insights, price targets, and potential trend movements: BEL Elliott Wave Technical Analysis

This analysis offers an in-depth look at Bharat Electronics (BEL) stock using Elliott Wave theory, c...

Read More >
Swiss Market Index Elliott Wave Technical Analysis: Bullish Orange Wave 3 Insights and Market Projections

Swiss Market Index Elliott Wave Technical Analysis: Bullish Orange Wave 3 Insights and Market Projections

The Swiss Market Index (SMI) is in a bullish impulsive phase as analyzed through Elliott Wave Theory...

Read More >

$1 for 2 Weeks

then $29 a month!

What a Special Offer!

Trade Recommendations

Unleash the power of deversified trading with our comprehensive portfolio, covering 250+ markets:

  • Stock Trades
  • Crypto Trades
  • Forex Trades
  • Commodity Trades
Elliott Wave Analysis

Gain a competitive edge with expert insights and AI-powered Elliott Wave charting into:

  • Global Indices
  • US Stocks & ASX Stocks
  • Forex & Crypto
  • Commodities
Top-Notch Trading Tools

Equip yourself with the tools of success:

  • Real-time Chat rooms
  • Elliott Wave Algorithm
  • Portfolio tools
  • TradingLevels
  • Screener
  • Trading Game
7 Elliott Wave Analysts

Stay ahead of the market with daily charts and insightful videos
Your secret to strategic trading!

JOIN HERE


Welcome to TradingLounge (ASIC A.R.No. 321187), specialists in trades, trading education and technical analysis, covering stocks, indices, commodities, forex and cryptocurrencies.

When you join TradingLounge you have access to everything we offer, including trade tools, educational content and a social platform to chat with like-minded investors.

Read more

@Copyright 2024 by tradinglounge.com

Contact Us

Australian no: 02 4787 6020

International no: +61 (2) 47876020

Pay with:

Find us on