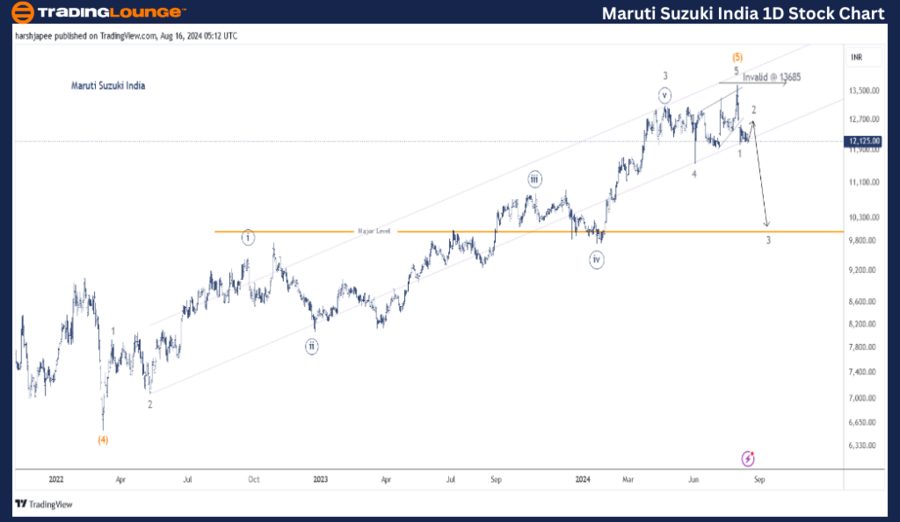
MARUTI SUZUKI INDIA – MARUTI (1D Chart) Elliott Wave Analysis

Function: Counter Trend Lower (Intermediate Degree, Orange)

Mode: Corrective

Structure: Impulse, Within Larger Degree Wave A

Position: Minor Wave 1 Grey Complete

Details: Minor Wave 2 Underway Towards 12700-800 Zone

Invalidation Point: 13685

Maruti Suzuki Stock Daily Chart Analysis and Potential Technical Scenarios

Maruti Suzuki Elliott Wave Technical Analysis 

Maruti Suzuki’s daily chart analysis suggests that the stock might have completed its fifth wave at Minor, Intermediate, and Primary (not shown) degrees around the 13685 mark. This high was recorded on July 31, 2024, followed by a decline below Minute Wave ((4)) at 12367.

The broader wave structure indicates that Intermediate Wave (4) bottomed around 6546 in March 2022. Since then, the rally has likely subdivided into five waves (impulse), culminating in Intermediate Wave (5) around the 13685 level.

If this structure holds, Maruti Suzuki may be entering a larger degree corrective wave that has just started, moving against the 13685 high. However, a push through this high would invalidate the bearish scenario.

Maruti-Suzuki-India-...


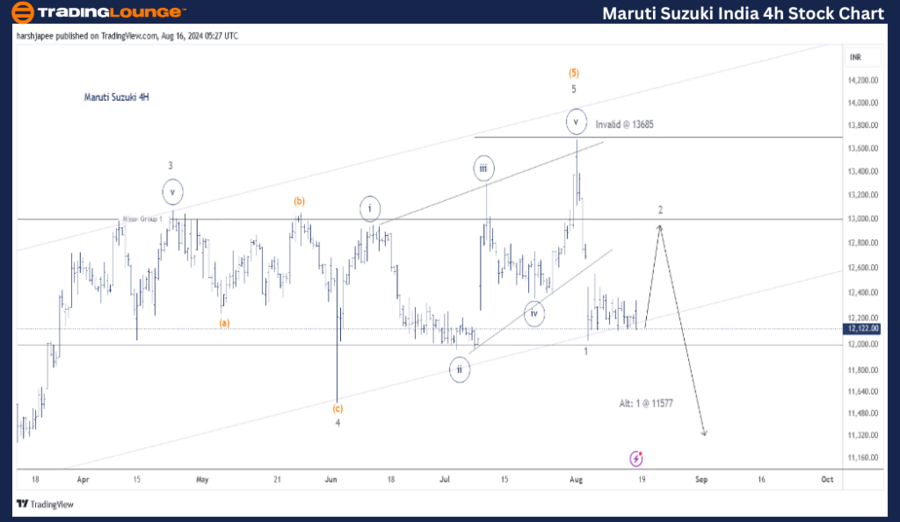
Maruti Suzuki 4-Hour Chart: MARUTI Elliott Wave Analysis 

Maruti Suzuki 4-Hour Chart: Elliott Wave Analysis and Potential Technical Scenarios

The 4-hour chart for Maruti Suzuki also indicates a potential top at the 13685 level. Minor Wave 5 of Intermediate Wave (4) unfolded as an ending diagonal, typically signaling the exhaustion of a larger uptrend.

Ending diagonals usually lead to swift price reversals, breaking the fourth wave termination, which is evident in the price action between 13685 and 12120. This drop could be labeled as Minor Wave 1, likely to be followed by a corrective Wave 2.

Alternatively, if Minor Wave 1 is still progressing, another drop could occur, potentially breaching the 11576 lows—the termination point of Minor Wave 4 and the minimum expected drop after a diagonal. In this case, the corrective rally of Minor Wave 2 would be delayed.

Conclusion

Maruti Suzuki stock appears to be setting up for a larger degree corrective drop, at least at the Intermediate degree, moving against the 13685 high.

Technical Analyst: Harsh Japee

Source: visit Tradinglounge.com and learn From the Experts Join TradingLounge Here 

Special Trial Offer - 0.76 Cents a Day for 3 Months! Click here

Access 7 Analysts Over 170 Markets Covered. Chat Room With Support

Maruti-Suzuki-India-...

Related

CIPLA Elliott Wave Technical Analysis: Stock Forecast, Trend Outlook, Price Target, Support & Resistance for Smarter Trading Decisions

CIPLA Elliott Wave Technical Analysis: Stock Forecast, Trend Outlook, Price Target, Support & Resistance for Smarter Trading Decisions

CIPLA stock analysis provides an in-depth look at Elliott Wave counts, highlighting trend direction,...

Read More >
Nikkei 225 (N225) Elliott Wave Forecast Shows Bullish Wave 3 Structure with Strong Uptrend Signals Across Daily and Weekly Charts

Nikkei 225 (N225) Elliott Wave Forecast Shows Bullish Wave 3 Structure with Strong Uptrend Signals Across Daily and Weekly Charts

Nikkei 225 reveals a strong bullish trend with impulsive wave formations on both daily and weekly ch...

Read More >
NEOUSD Elliott Wave Technical Analysis: Where we break down NEO's Price Movements, Trading Strategies, and Key Indicators

NEOUSD Elliott Wave Technical Analysis: Where we break down NEO's Price Movements, Trading Strategies, and Key Indicators

Explore the comprehensive NEOUSD Elliott Wave analysis, where we break down NEO's price movement...

Read More >
Exploring ASX Trading Success: ASX LIMITED – ASX Stock Analysis & Elliott Wave Technical Forecast

Exploring ASX Trading Success: ASX LIMITED – ASX Stock Analysis & Elliott Wave Technical Forecast

Dive deep into the financial waters of ASX Limited with our detailed analysis. Leveraging Elliott Wa...

Read More >
Theta Token/U.S. dollar(THETAUSD) Elliott Wave Technical Analysis 30 October 23

Theta Token/U.S. dollar(THETAUSD) Elliott Wave Technical Analysis 30 October 23

Elliott Wave Analysis TradingLounge Daily Chart, 30 October 23,Theta Token/U.S. dollar(THETAUSD)THET...

Read More >
Elliott Wave Analysis Highlights: Navigating Commodity Market Trends with Confidence

Elliott Wave Analysis Highlights: Navigating Commodity Market Trends with Confidence

This summary highlights the key points from an Elliott Wave analysis update on commodity markets. Th...

Read More >

Buy 1 Month

Get 3 Months!

Special Offer:

Trade Recommendations

Unleash the power of deversified trading with our comprehensive portfolio, covering:

  • Stock Trades
  • Crypto Trades
  • Forex Trades
  • Commodity Trades
Elliott Wave Analysis

Gain a competive edge with expert insights in to:

  • Global Indices
  • US Stocks & ASX Stocks
  • Forex & Crypto
  • Commodities
Top-Notch Trading Tools

Equip yourself with the tools of success:

  • Social Chat
  • Elliott Wave Algorithm
  • Screener
  • TradingLevels
  • Trading Game
7 Elliott Wave Analysts

Stay ahead of the market with daily charts and insightful videos
-Your secret to strategic trading!

JOIN HERE


Welcome to TradingLounge (ASIC A.R.No. 321187), specialists in trades, trading education and technical analysis, covering stocks, indices, commodities, forex and cryptocurrencies.

When you join TradingLounge you have access to everything we offer, including trade tools, educational content and a social platform to chat with like-minded investors.

Read more

@Copyright 2024 by tradinglounge.com

Contact Us

Australian no: 02 4787 6020

International no: +61 (2) 47876020

Pay with:

Find us on