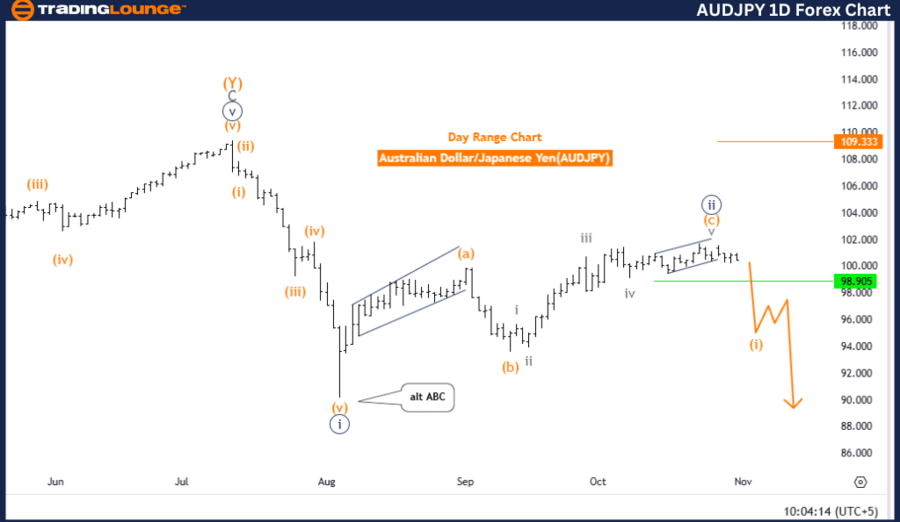
AUDJPY Elliott Wave Analysis - Trading Lounge Day Chart
Australian Dollar / Japanese Yen (AUDJPY) Day Chart
AUDJPY Elliott Wave Technical Analysis
Function: Bearish Trend
Mode: Impulsive
Structure: Orange wave 1
Position: Navy blue wave 3
Next Lower Degree Direction: Orange wave 1 (initiated)
Details:
The recent charting shows navy blue wave 2 potentially complete, with the active movement of orange wave 1 of 3 initiating.
Wave Cancel Level: 109.333
AUDJPY Day Chart Analysis
In the daily chart for AUDJPY, Elliott Wave analysis suggests a bearish trend within an impulsive structure. This downward movement, identified as orange wave 1 within the broader navy blue wave 3, aligns with an ongoing bearish trend.
With the recent completion of navy blue wave 2, orange wave 1 of 3 appears underway, marking the beginning phase within the larger wave 3 sequence. This wave formation points towards continued downside pressure as the impulsive structure of orange wave 1 within navy blue wave 3 projects further bearish momentum. The strengthening progression of navy blue wave 3 supports a bearish outlook, suggesting an extension of the downtrend as orange wave 1 continues.
The wave cancel level is set at 109.333. Any movement above this threshold invalidates the current Elliott Wave structure, potentially signaling a need to reassess the downward trend. However, as long as AUDJPY remains below this point, the analysis favors the continuation of the bearish trend, supporting further development of navy blue wave 3.
Summary
The Elliott Wave analysis on AUDJPY’s daily chart highlights a strong bearish outlook driven by orange wave 1 within navy blue wave 3. With navy blue wave 2 likely complete, additional declines are anticipated as long as prices stay below 109.333, indicating further downward pressure consistent with a typical wave 3 formation.
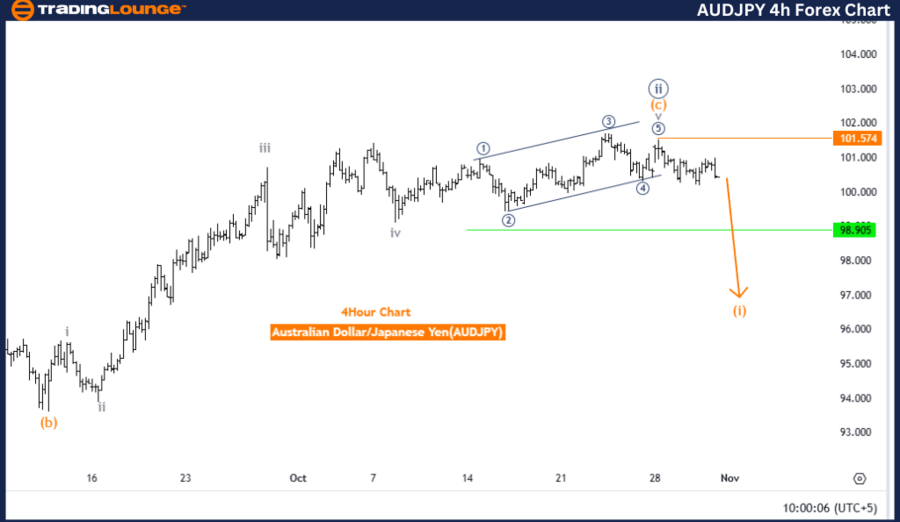
Australian Dollar / Japanese Yen (AUDJPY) 4-Hour Chart
AUDJPY Elliott Wave Technical Analysis
Function: Bearish Trend
Mode: Impulsive
Structure: Orange wave 1
Position: Navy blue wave 3
Next Lower Degree Direction: Orange wave 1 (initiated)
Details: The completion of navy blue wave 2 is anticipated, with orange wave 1 of 3 currently active.
Wave Cancel Level: 101.574
AUDJPY 4-Hour Chart Analysis
In the 4-hour chart, Elliott Wave analysis reveals a bearish trend within an impulsive structure. This development, identified as orange wave 1 within a larger navy blue wave 3, points to the beginning of a downward phase. The apparent completion of navy blue wave 2 signals an end to the retracement and the onset of a new downward sequence in navy blue wave 3.
With orange wave 1 active, the analysis forecasts a bearish continuation in the short term. This initial movement within navy blue wave 3 supports a downward trend if the wave structure holds. The current trend is expected to continue as orange wave 1 within navy blue wave 3 amplifies the bearish trajectory, indicating potential further downside.
The wave cancel level is at 101.574, marking a crucial invalidation point. A rise above this level would require a re-evaluation of the current bearish wave structure, suggesting a possible shift in trend direction. Staying below this threshold, however, aligns with the bearish outlook, reinforcing the projected decline as navy blue wave 3 unfolds.
Summary
The Elliott Wave analysis for AUDJPY’s 4-hour chart highlights a bearish trend driven by an impulsive orange wave 1 within navy blue wave 3. The current wave structure points to further downside movement, contingent upon staying below the wave cancel level of 101.574. This setup suggests an extended bearish trend as navy blue wave 3 progresses.
Technical Analyst: Malik Awais
Source: visit Tradinglounge.com and learn From the Experts Join TradingLounge Here
Previous: USDCAD Elliott Wave Technical Analysis
VALUE Offer - Buy 1 Month & Get 3 Months!Click here
Access 7 Analysts Over 200 Markets Covered. Chat Room With Support