29Nov

Elliott Wave Technical Analysis of S&P/TSX 60: Bullish Trends, Upward Momentum, Invalidation Levels, and Trading Insights for Daily & Weekly Charts

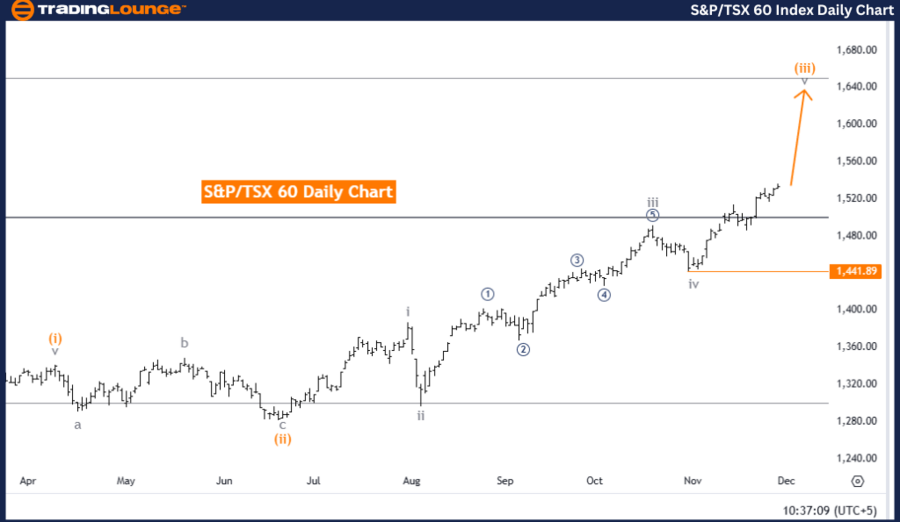
S&P/TSX 60 Elliott Wave Analysis - Trading Lounge Daily Chart

S&P/TSX 60 Elliott Wave Technical Analysis

Technical Details

Function: Bullish Trend

Mode: Impulsive

Structure: Gray wave 5

Position: Orange wave 3

Direction (Next Lower Degrees): Orange wave 4 (pending)

Details
This analysis evaluates the S&P/TSX 60 index on a daily chart utilizing Elliott Wave theory. The study identifies a bullish trend in impulsive mode, highlighting gray wave 5 within orange wave 3. The completion of gray wave 4 marked the initiation of gray wave 5, suggesting a continuation of the upward momentum.

Currently, the market is positioned within orange wave 3, specifically in its final phase—gray wave 5. This stage precedes the expected correction phase in orange wave 4, set at a lower degree of the wave cycle.

  • Invalidation Level: 1,441.89
    A decline to this level will invalidate the current wave count and bullish outlook, making it a critical level for both risk management and trend confirmation.

Summary
The Elliott Wave analysis confirms the S&P/TSX 60 index is in a bullish impulsive trend, with gray wave 5 active within orange wave 3. The initiation of gray wave 5 followed the completion of gray wave 4, reinforcing the bullish trajectory. As long as the index stays above the invalidation level of 1,441.89, the bullish outlook remains valid. Further upward momentum is expected before transitioning to orange wave 4's corrective phase.

S&P-TSX-60-Index-Dai...


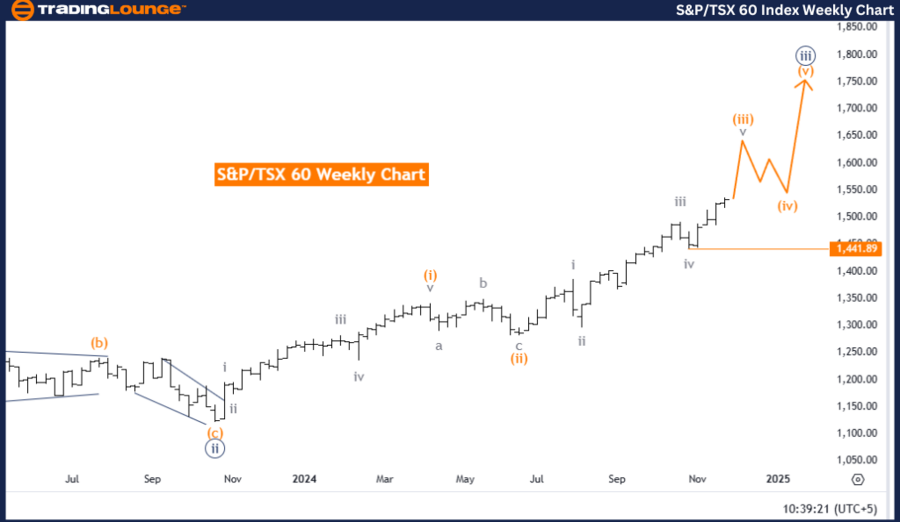
S&P/TSX 60 Elliott Wave Analysis - Trading Lounge Weekly Chart

S&P/TSX 60 Elliott Wave Technical Analysis

Technical Details

Function: Bullish Trend

Mode: Impulsive

Structure: Orange wave 3

Position: Navy Blue Wave 3

Direction (Next Lower Degrees): Orange wave 4 (upcoming)

Details
This analysis inspects the S&P/TSX 60 index on a weekly chart, applying Elliott Wave theory to identify a strong bullish trend. The current structure emphasizes orange wave 3, which has been progressing following the completion of orange wave 2, signalling sustained upward momentum.

The market is now within navy blue wave 3, which is part of the broader orange wave 3 structure. This represents a significant impulsive movement, with further gains anticipated before entering the correction phase of orange wave 4 at a lower degree.

  • Invalidation Level: 1,441.89
    Falling below this level will invalidate the bullish wave count, making it a key point for trend confirmation and risk management.

Summary
The Elliott Wave analysis for the weekly chart highlights a robust bullish trend in the S&P/TSX 60 index, with orange wave 3 advancing within navy blue wave 3. The conclusion of Orange Wave 2 confirmed the start of this strong impulsive movement. The bullish outlook holds as long as the index remains above the invalidation level of 1,441.89. Continued upward momentum is expected as orange wave 3 develops further, reinforcing the positive trend.

Technical Analyst: Malik Awais

Source: visit Tradinglounge.com and learn From the Experts Join TradingLounge Here 

Previous: CAC 40 (France) Index Elliott Wave Technical Analysis 

VALUE Offer - Buy 1 Month & Get 3 Months!Click here

Access 7 Analysts Over 200 Markets Covered. Chat Room With Support

S&P-TSX-60-weekly-Da...

Related

JP Morgan Chase & Co.(JPM:NYSE) Elliott Wave Technical Analysis 13 November 23

JP Morgan Chase & Co.(JPM:NYSE) Elliott Wave Technical Analysis 13 November 23

JP Morgan Chase & Co., Stock Market Analysis - Trading Lounge Elliott Wave Technical Analysis Chart ...

Read More >
Elliott Wave Analysis of Dow Jones (DJI): Insights on Corrective Phase with Orange Wave B and Navy Blue Wave 4 Trends

Elliott Wave Analysis of Dow Jones (DJI): Insights on Corrective Phase with Orange Wave B and Navy Blue Wave 4 Trends

The Dow Jones Industrial Average (DJI) using Elliott Wave Theory highlights the progression of orang...

Read More >
CAC 40 Elliott Wave Analysis: Bullish Trend, Market Forecast, and Technical Insights for Investors

CAC 40 Elliott Wave Analysis: Bullish Trend, Market Forecast, and Technical Insights for Investors

Elliott Wave analysis of the CAC 40 index, covering bullish trends, wave structures, and key technic...

Read More >
National Australia Bank Limited Stock Analysis - NAB Elliott Wave Technical Forecast and Trading Strategies

National Australia Bank Limited Stock Analysis - NAB Elliott Wave Technical Forecast and Trading Strategies

This article provides an in-depth Elliott Wave analysis of NAB (National Australia Bank) stock on th...

Read More >
PepsiCo Inc. (PEP) Elliott Wave Analysis: Key Support at $150 Signals Potential Wave 3 Rally and Long-Term Bullish Trend Reversal

PepsiCo Inc. (PEP) Elliott Wave Analysis: Key Support at $150 Signals Potential Wave 3 Rally and Long-Term Bullish Trend Reversal

PepsiCo (PEP) is approaching key support at $150, marking a potential bottom in Minor wave 2. A conf...

Read More >
New Zealand Dollar/U.S.Dollar (NZDUSD) Chart Elliott Wave Technical Analysis 27 October 23

New Zealand Dollar/U.S.Dollar (NZDUSD) Chart Elliott Wave Technical Analysis 27 October 23

In summary, the NZD/USD Elliott Wave Analysis for the Day Chart on 27 October 23, offers substantial...

Read More >

Buy 1 Month

Get 3 Months!

Special Offer:

Trade Recommendations

Unleash the power of deversified trading with our comprehensive portfolio, covering:

  • Stock Trades
  • Crypto Trades
  • Forex Trades
  • Commodity Trades
Elliott Wave Analysis

Gain a competive edge with expert insights in to:

  • Global Indices
  • US Stocks & ASX Stocks
  • Forex & Crypto
  • Commodities
Top-Notch Trading Tools

Equip yourself with the tools of success:

  • Social Chat
  • Elliott Wave Algorithm
  • Screener
  • TradingLevels
  • Trading Game
7 Elliott Wave Analysts

Stay ahead of the market with daily charts and insightful videos
-Your secret to strategic trading!

JOIN HERE


Welcome to TradingLounge (ASIC A.R.No. 321187), specialists in trades, trading education and technical analysis, covering stocks, indices, commodities, forex and cryptocurrencies.

When you join TradingLounge you have access to everything we offer, including trade tools, educational content and a social platform to chat with like-minded investors.

Read more

@Copyright 2024 by tradinglounge.com

Contact Us

Australian no: 02 4787 6020

International no: +61 (2) 47876020

Pay with:

Find us on