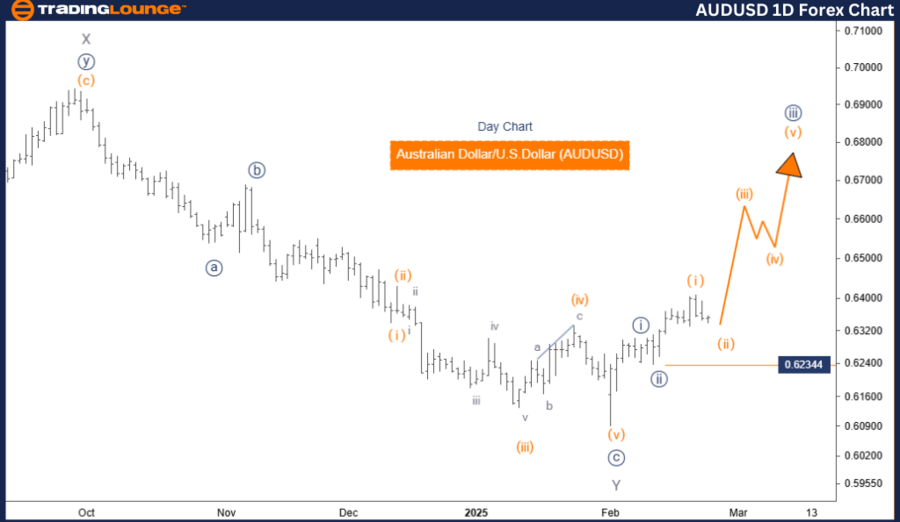
Australian Dollar/U.S. Dollar (AUDUSD) Day Chart
AUDUSD Elliott Wave Technical Analysis
Function: Bullish Trend
Mode: Impulsive
Structure: Navy Blue Wave 3
Position: Gray Wave 1
Next Lower Degree Direction: Navy Blue Wave 4
Wave Cancellation Invalid Level: 0.62344
Analysis Overview:
The AUDUSD Elliott Wave Analysis for the daily chart highlights a bullish trend, with the market in an impulsive mode. The wave structure is currently in Navy Blue Wave 3, signaling a continuation of an upward movement within Gray Wave 1. This aligns with the impulsive nature of the wave pattern, supporting ongoing bullish momentum.
The next expected move is Navy Blue Wave 4, which will likely start upon the completion of Navy Blue Wave 3.
Key Insights:
- Wave 2 Completion: The analysis suggests that Navy Blue Wave 2 has likely ended, paving the way for the current impulse wave.
- Wave 3 Progression: Navy Blue Wave 3 is unfolding, exhibiting strong bullish momentum, consistent with Elliott Wave principles.
- Potential Corrective Phase: After Wave 3 concludes, Navy Blue Wave 4 may introduce a temporary pullback or consolidation before the overall uptrend resumes.
Critical Level to Watch:
- The wave cancellation invalidation level is set at 0.62344.
- A break below 0.62344 would invalidate the current wave count, necessitating a reassessment of the Elliott Wave structure.
- This level serves as a key support zone, and a breach could signal a potential trend reversal or shift in market structure.
Conclusion:
The AUDUSD market maintains its bullish outlook, with Navy Blue Wave 3 actively unfolding after the completion of Navy Blue Wave 2. The upcoming Navy Blue Wave 4 is expected to introduce a corrective phase before the broader uptrend continues.
Traders should closely monitor the 0.62344 level, as it serves as a key support threshold for validating the wave count. Understanding Elliott Wave patterns is essential for anticipating price movements and optimizing trading strategies effectively.
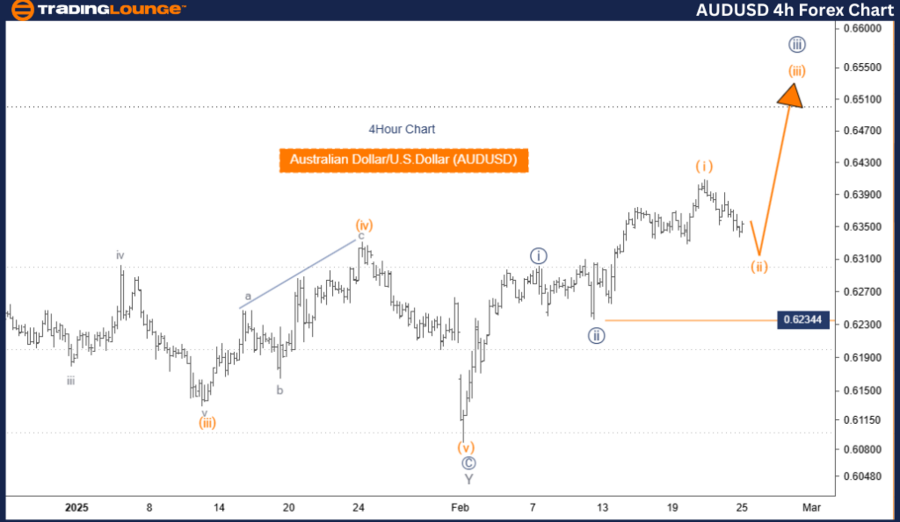
Australian Dollar/U.S. Dollar (AUDUSD) 4-Hour Chart
AUDUSD Elliott Wave Technical Analysis
Function: Counter Trend
Mode: Corrective
Structure: Orange Wave 2
Position: Navy Blue Wave 3
Next Higher Degree Direction: Orange Wave 3
Wave Cancellation Invalid Level: 0.62344
Analysis Overview:
The 4-hour Elliott Wave Analysis of AUDUSD suggests a counter-trend scenario, indicating a corrective phase in the market. The current wave structure is Orange Wave 2, forming part of a broader corrective pattern within Navy Blue Wave 3. This phase represents an intermediate pullback before the market resumes its dominant trend.
The next anticipated movement is Orange Wave 3, expected to emerge once Orange Wave 2 concludes.
Key Insights:
- Wave 1 Completion: Orange Wave 1 appears to have ended, marking the transition into Orange Wave 2.
- Corrective Characteristics: Orange Wave 2 is expected to display sideways or downward movement, typical of corrective waves.
- Next Impulse Move: Once Orange Wave 2 is complete, Orange Wave 3 is expected to begin, aligning the market with the larger trend.
Critical Level to Watch:
- The wave cancellation invalidation level is 0.62344.
- A break above 0.62344 would invalidate the current wave count, requiring a reassessment of market conditions.
- This level serves as a key resistance zone, and a breakout could indicate a potential trend reversal.
Conclusion:
The AUDUSD market is currently experiencing a corrective phase, with Orange Wave 2 in motion following the conclusion of Orange Wave 1. This correction is occurring within Navy Blue Wave 3, and the next significant move is expected to be Orange Wave 3.
Traders should monitor the completion of Orange Wave 2, as it will provide insights into the timing and direction of the next impulsive wave. Understanding Elliott Wave structures is key to identifying price trends and making strategic trading decisions.
Technical Analyst: Malik Awais
Source: visit Tradinglounge.com and learn From the Experts Join TradingLounge Here
Previous: GBPUSD Elliott Wave Technical Analysis
VALUE Offer - Buy 1 Month & Get 3 Months!Click here
Access 7 Analysts Over 200 Markets Covered. Chat Room With Support