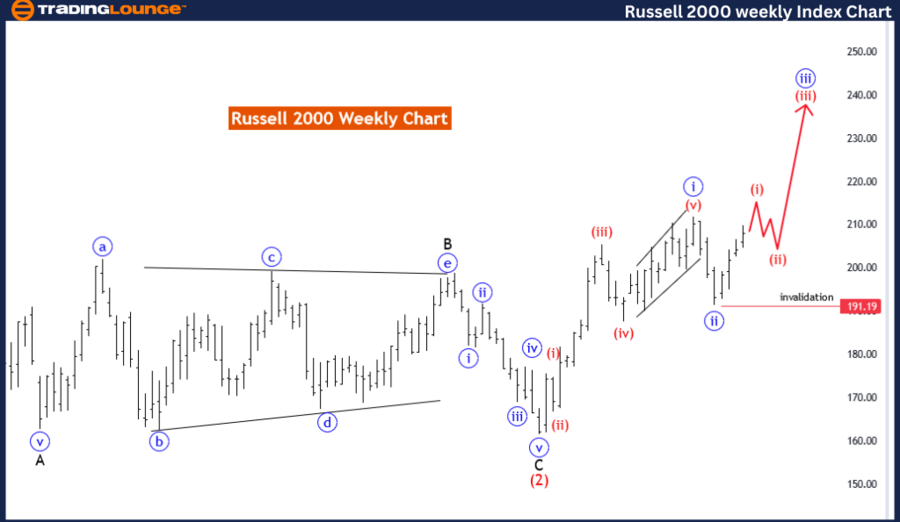
RUSSELL 2000 Elliott Wave Analysis Trading Lounge Day Chart,
RUSSELL 2000 Elliott Wave Technical Analysis
FUNCTION: Trend
MODE: impulsive
STRUCTURE: red wave 1
POSITION: Blue Wave 3
DIRECTION NEXT LOWER DEGREES: red wave 2
DETAILS: Blue Wave 2 looking completed at 191.19. Now red wave 1 of blue wave 3 is in play. Wave Cancel invalid level: 191.19
The Elliott Wave analysis for the Russell 2000 index on the daily chart offers a detailed perspective on its current market trends. This analysis categorizes the function as a trend, indicating a movement in line with the overall market direction. The mode is described as impulsive, suggesting a strong and directional movement typically characterized by a five-wave pattern.
In this analysis, the primary wave structure under consideration is red wave one, and the current position is identified within blue wave three. This implies that the market is currently in the third wave of a five-wave impulsive sequence, which is often the strongest and most extended wave within the Elliott Wave theory.
The direction for the next lower degrees is set to red wave two, indicating that after the completion of the current impulsive wave, a corrective phase (wave two) is expected. This would typically involve a retracement of the initial impulsive move before continuing in the direction of the overall trend.
Key details noted in the analysis include the completion of blue wave two at a specific level. With this wave now completed, the market is progressing into red wave one of blue wave three. This transition marks the beginning of the next phase in the impulsive sequence, often characterized by strong and directional price movements.
An important aspect of the analysis is the wave cancel invalid level, set at the same level as the completion of blue wave two. This level serves as a critical threshold; if the market were to move beyond this point, it would invalidate the current wave count. This necessitates a reassessment of the wave structure and could indicate a potential change in market direction.
In summary, the Elliott Wave analysis for the Russell 2000 index on the daily chart highlights an ongoing impulsive trend within red wave one of blue wave three. The market has completed blue wave two and is now advancing in red wave one. An invalidation level is crucial for monitoring potential shifts in the market’s behavior, ensuring accurate tracking of the Elliott Wave pattern.
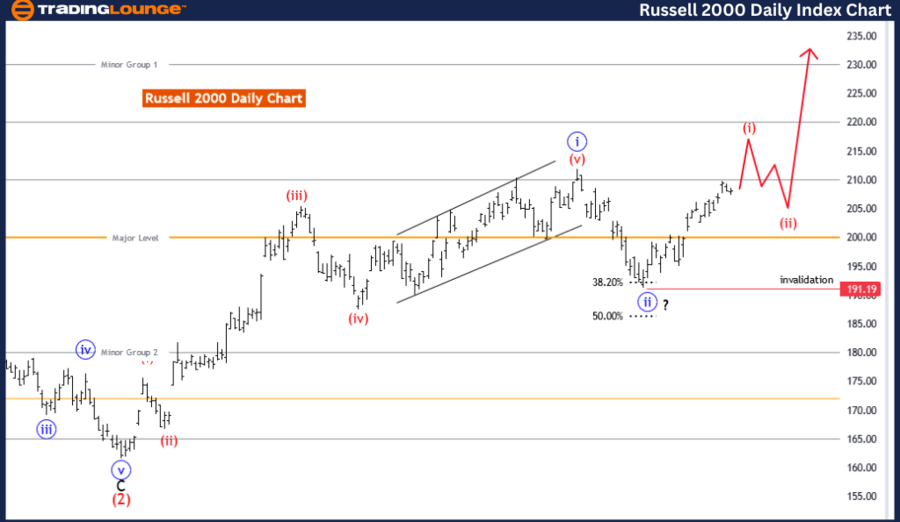
RUSSELL 2000 Elliott Wave Analysis Trading Lounge Weekly Chart,
RUSSELL 2000 Elliott Wave Technical Analysis
FUNCTION: Trend
MODE: impulsive
STRUCTURE: red wave 1
POSITION: Blue Wave 3
DIRECTION NEXT LOWER DEGREES: red wave 2
DETAILS: Blue Wave 2 looking completed at 191.19. Now red wave 1 of blue wave 3 is in play.
Wave Cancel invalid level: 191.19
The Elliott Wave analysis for the Russell 2000 index on the weekly chart presents a comprehensive overview of the current market trends. The function is identified as a trend, indicating alignment with the broader market direction. The mode is classified as impulsive, suggesting a strong, directional movement that is typically seen in a five-wave pattern.
The primary wave structure in focus is red wave one, with the current market position situated within blue wave three. This signifies that the index is in the third wave of a five-wave impulsive sequence, often the most powerful and extended wave within the Elliott Wave theory.
The direction for the next lower degrees is red wave two, which implies that after the completion of the current impulsive wave, a corrective phase (red wave two) is anticipated. This phase generally involves a retracement of the initial impulsive move before the market continues in the overall trend direction.
Significant details from the analysis include the completion of blue wave two at a specific level. With this wave completed, the market is now advancing into red wave one of blue wave three. This transition marks the beginning of the next impulsive sequence, typically characterized by strong and directional price movements.
A critical aspect of this analysis is the wave cancel invalid level, set at the same point as the completion of blue wave two. This level acts as a vital threshold; if the market moves beyond this point, it would invalidate the current wave count. This necessitates a reassessment of the wave structure and could indicate a potential shift in the market direction.
In summary, the Elliott Wave analysis for the Russell 2000 index on the weekly chart indicates an ongoing impulsive trend within red wave one of blue wave three. With the completion of blue wave two, the market is now progressing into red wave one. The invalidation level is crucial for monitoring possible changes in the market’s behaviour, ensuring accurate tracking of the Elliott Wave pattern.
Technical Analyst: Malik Awais
Source: visit Tradinglounge.com and learn From the Experts Join TradingLounge Here
See previous: S&P/ASX 200 Elliott Wave Technical Analysis
Special Trial Offer - 0.76 Cents a Day for 3 Months! Click here
Access 7 Analysts Over 170 Markets Covered. Chat Room With Support