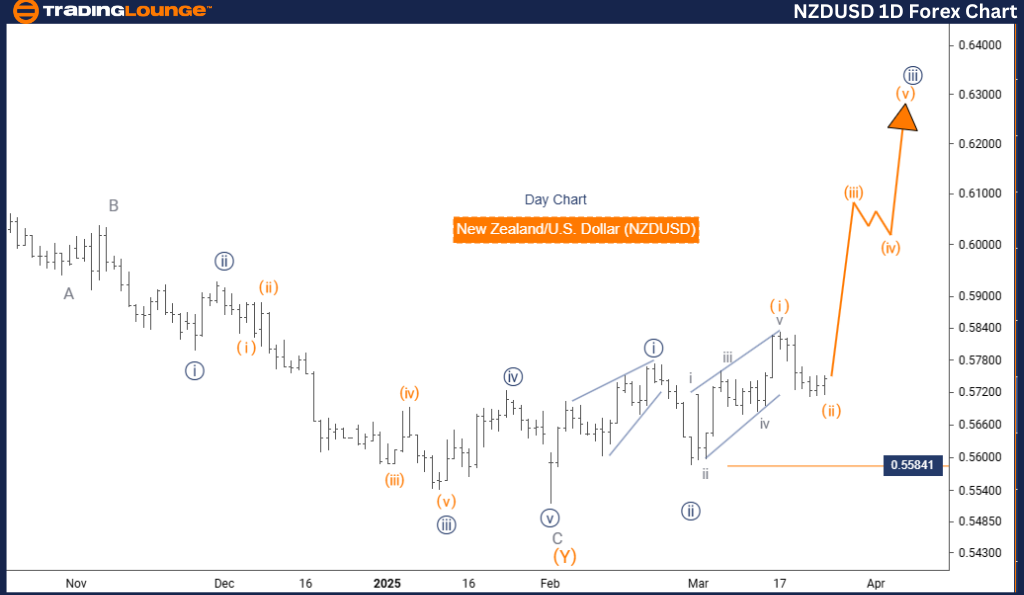
New Zealand Dollar / U.S. Dollar (NZDUSD) Elliott Wave Analysis – TradingLounge Day Chart
NZDUSD Elliott Wave Technical Analysis
Function: Bullish Trend
Mode: Impulsive
Structure: Navy Blue Wave 3
Position: Gray Wave 1
Direction Next Higher Degrees: Navy Blue Wave 3 (continuing)
Wave Cancel Invalid Level: 1.55841
The daily chart analysis of the NZDUSD pair using Elliott Wave principles reflects a strong bullish trend continuation. The market currently progresses through navy blue wave 3, while gray wave 1 evolves inside it. Confirmation of navy blue wave 2's completion supports the upward momentum currently active in wave 3.
This phase is typically marked by significant price acceleration and increased market participation. The critical invalidation point is placed at 1.55841—any drop below this level would question the bullish Elliott Wave count and could suggest a possible trend reversal.
From a daily time-frame perspective, this setup provides traders with trend-following opportunities while maintaining alignment with the overarching bullish wave count. The evolving navy blue wave 3 offers a compelling entry within the ongoing structure of gray wave 1.
Key signs that reinforce the impulsive nature of wave 3 include sustained price rallies, increased trading volume, and growing market momentum. Maintaining buy-side trades is consistent with the current wave structure, though traders are advised to manage risk carefully near the invalidation point.
This Elliott Wave forecast enhances strategic decision-making by offering insight into both short-term trade entries and long-term structural alignment. Adopting this framework allows traders to act with clarity and confidence in the NZDUSD market.
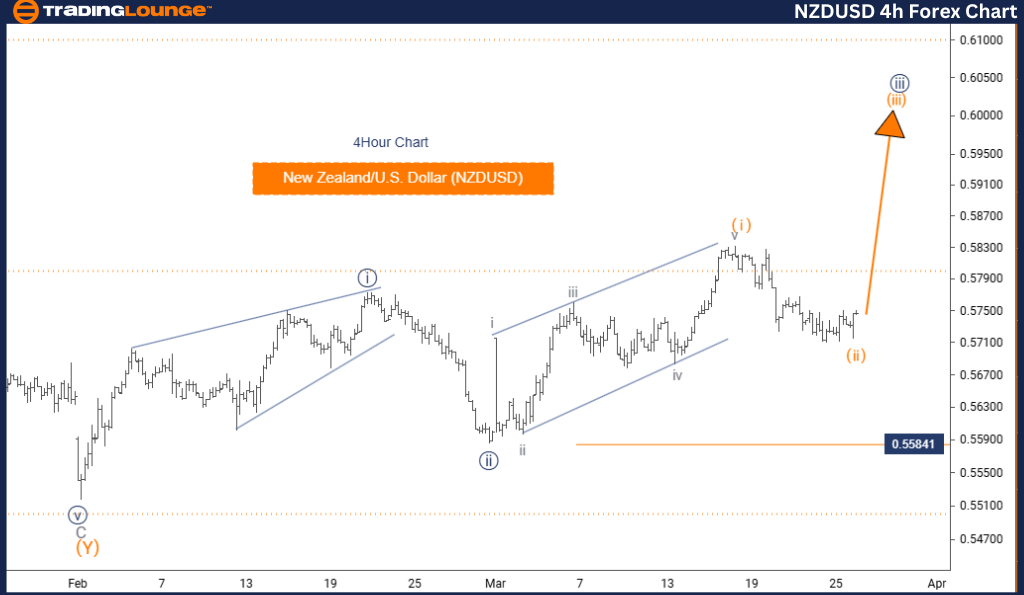
New Zealand Dollar / U.S. Dollar (NZDUSD) Elliott Wave Analysis – TradingLounge 4-Hour Chart
NZDUSD Elliott Wave Technical Analysis
Function: Bullish Trend
Mode: Impulsive
Structure: Orange Wave 3
Position: Navy Blue Wave 3
Direction Next Higher Degrees: Orange Wave 3 (started)
Wave Cancel Invalid Level: 1.55841
The 4-hour Elliott Wave forecast for NZDUSD reinforces a bullish market outlook, emphasizing a strong impulsive structure. The pair continues upward within orange wave 3, which belongs to the broader navy blue wave 3. Analysts have confirmed orange wave 2's completion, suggesting that orange wave 3 is now actively developing.
This segment is generally known for delivering extended bullish moves and serves as a powerful confirmation of the prevailing trend. The key invalidation level remains at 1.55841—a break below could revise the current outlook.
From a 4-hour chart perspective, this structure helps traders fine-tune entry timing and short-term strategy while staying aligned with the major bullish pattern. Orange wave 3 presents both a tactical opportunity and a continuation signal for the larger wave count.
Indicators of impulsive movement such as sharp upward price action, growing buy-side volume, and momentum confirmation are expected. Keeping long trades is appropriate under current conditions, provided proper stop-loss placement near the invalidation zone.
This Elliott Wave interpretation supports a structured trading strategy for the NZDUSD pair. By monitoring the wave count progression and respecting key technical levels, traders can enhance their accuracy and risk management in both short and longer time frames.
Technical Analyst: Malik Awais
Source: Visit Tradinglounge.com and learn from the Experts Join TradingLounge Here
Previous: USDCHF Elliott Wave Technical Analysis
VALUE Offer - Buy 1 Month & Get 3 Months!Click here
Access 7 Analysts Over 200 Markets Covered. Chat Room With Support