Welcome to our latest Elliott Wave analysis for Deere & Co. (DE), In this report, we provide a detailed examination of DE's price movements and future projections using the Elliott Wave Theory. This analysis will cover both the daily and 4-hour charts, offering insights into the current trends and potential trading opportunities. Whether you are a seasoned trader or a market enthusiast, this analysis aims to enhance your understanding of DE's market behavior.
DE Elliott Wave Analysis Trading Lounge Daily Chart
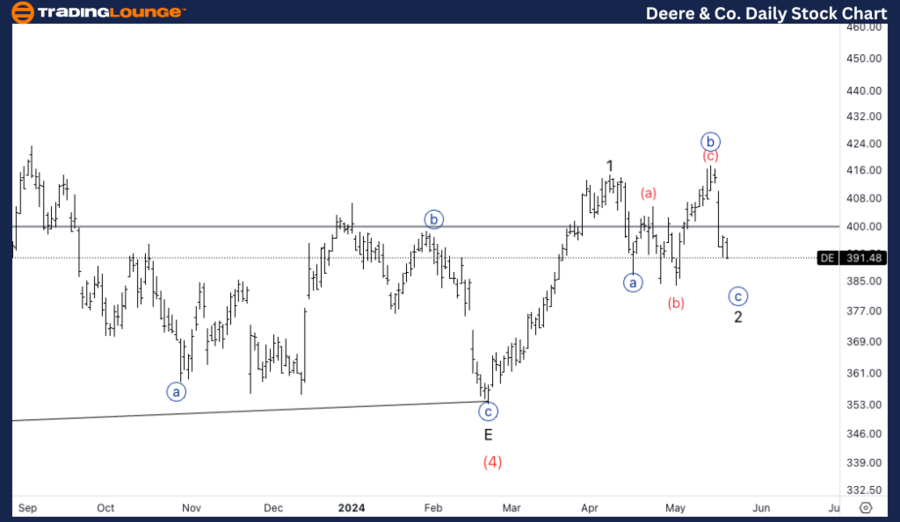
Deere & Co. (DE) Daily Chart Analysis
DE Elliott Wave Technical Analysis
Function: Trend
Mode: Impulsive
Structure: Motive
Position: Minor 2 of (1)
Direction: Bottoming in wave 2
Details: Expecting a three-wave move in wave 2 to be completed soon, anticipating a continuation higher.

DE Elliott Wave Analysis Trading Lounge 4Hr Chart
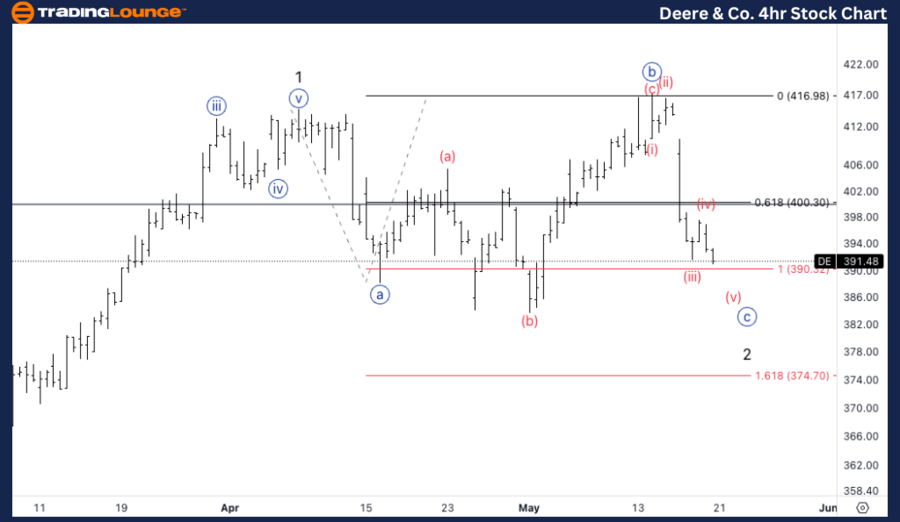
Deere & Co. (DE) 4Hr Chart Analysis
DE Elliott Wave Technical Analysis
Function: Counter Trend
Mode: Corrective
Structure: Flat
Position: Wave {c} of C
Direction: Wave (v) of {c}
Details: Looking for equality of {c} vs. {a} at $390. Expecting a Classic Trading Level Pattern around $400 to enter long positions.
On the 4-hour chart, DE is exhibiting a corrective mode within a flat structure, specifically positioned in wave {c} of C. We are looking for wave (v) of {c} to reach equality with wave {a} at the $390 level. Additionally, we expect a Classic Trading Level Pattern to emerge around the $400
Technical Analyst: Malik Awais
Source: visit Tradinglounge.com and learn From the Experts Join TradingLounge Here
See Previous: Chevron Inc., (CVX) Elliott Wave Analysis
Special Trial Offer - 0.76 Cents a Day for 3 Months! Click here
Access 7 Analysts Over 170 Markets Covered. Chat Room With Support
