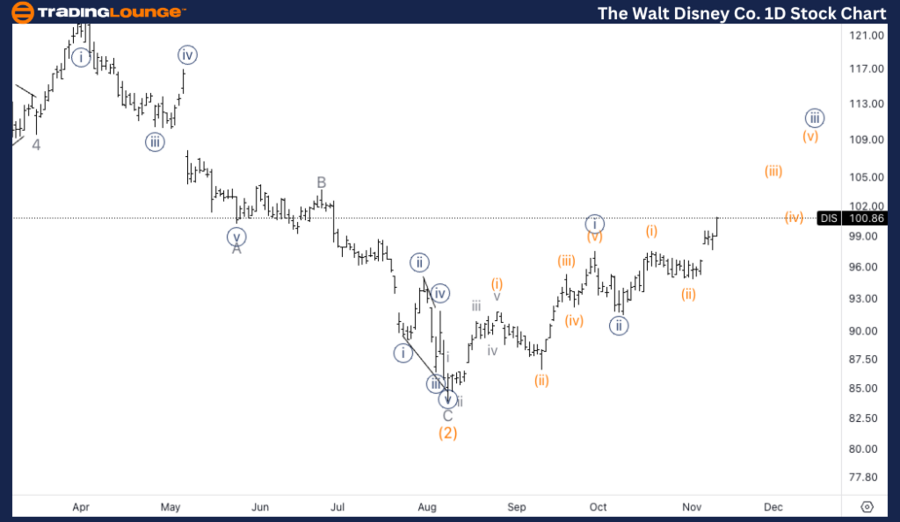
The Walt Disney Co. (DIS) Elliott Wave Analysis – Trading Lounge Daily Chart
DIS Elliott Wave Technical Analysis
Function: Trend
Mode: Impulsive
Structure: Motive
Position: Wave {iii} of 1
Direction: Upside in wave 1
Details
The longer-term wave count presents challenges as it remains uncertain whether the broader correction has concluded. A sustained move above $100 could serve as a key indicator, adding confluence to the potential resumption of an upward trend. This level could confirm that a new bullish phase is underway.
DIS Elliott Wave Technical Analysis – Daily Chart
The daily chart suggests that Walt Disney Co. is in the third wave ({iii}) of a larger wave 1 to the upside. However, there is still uncertainty regarding whether the broader correction has fully concluded. Trading above the $100 level would provide further confirmation of a potential longer-term uptrend. A break above this level would add confluence to the idea that a new bullish trend has begun, solidifying the wave count.

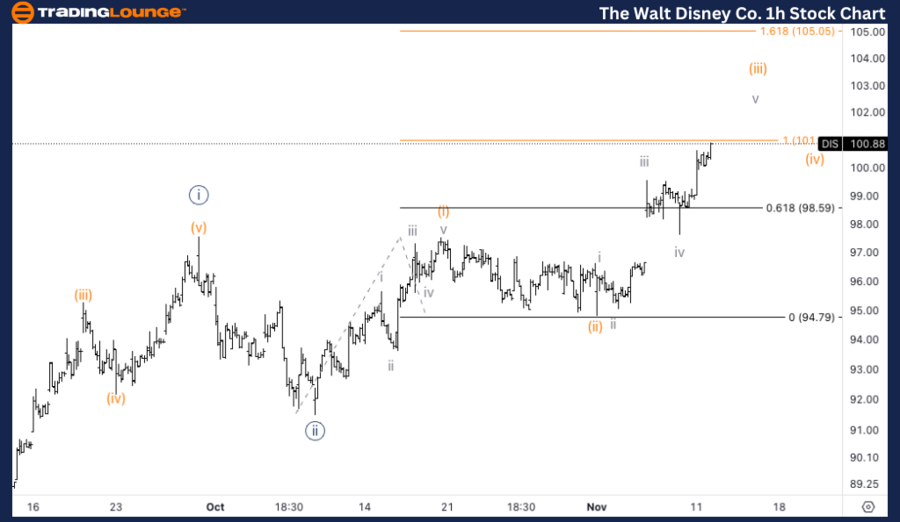
The Walt Disney Co. (DIS) Elliott Wave Analysis – Trading Lounge 1H Chart
DIS Elliott Wave Technical Analysis
Function: Trend
Mode: Impulsive
Structure: Motive
Position: Wave (iii) of {iii}
Direction: Top in wave (iii)
Details
The 1-hour chart highlights an ongoing wave (iii) of {iii}, showing a clear five-wave subdivision, confirming the impulsive structure. A potential top may form as the price nears equality between wave (iii) and wave (i) at $101, with an additional upside target at the 1.618 Fibonacci extension level of $105. These price points are critical as the market approaches the final stages of this wave.
DIS Elliott Wave Technical Analysis – 1H Chart
The 1-hour chart is currently tracking wave (iii) of {iii}, with the potential for further upside. A nice five-wave subdivision can be observed in this wave, suggesting that the impulsive nature is intact. A possible top is anticipated as the price approaches equality between wave (iii) and wave (i) at $101. Additionally, the 1.618 Fibonacci extension for this wave stands at $105, which could also be a significant level to watch as the market potentially reaches the final stages of this wave.
Technical Analyst: Alessio Barretta
Source: visit Tradinglounge.com and learn From the Experts Join TradingLounge Here
See Previous: META Elliott Wave Technical Analysis
VALUE Offer - Buy 1 Month & Get 3 Months!Click here
Access 7 Analysts Over 200 Markets Covered. Chat Room With Support

Summary
This Elliott Wave analysis examines the price action of The Walt Disney Co. (DIS) using daily and hourly charts. On the daily chart, the price appears to be in an upward wave 1, with further confirmation needed above the $100 level. On the 1-hour chart, wave (iii) of {iii} continues upward, with key levels at $101 and $105 offering critical targets for this wave's potential completion.