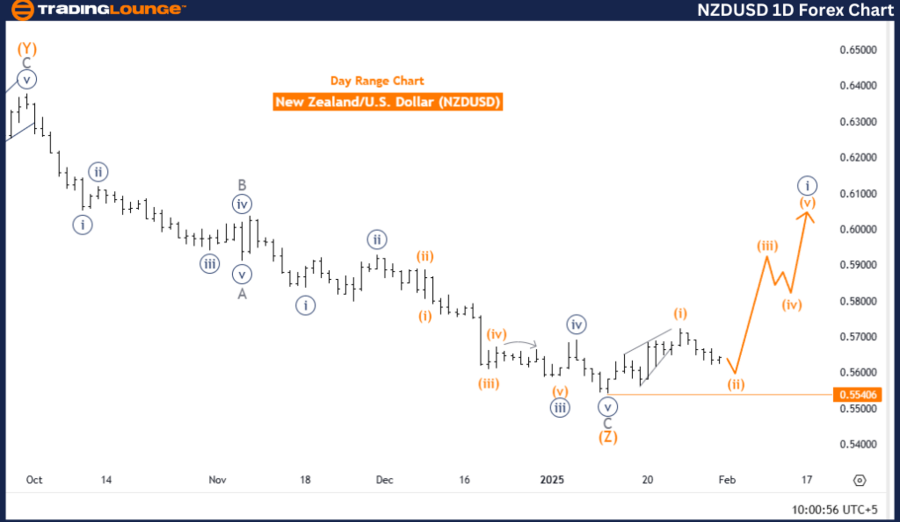
New Zealand Dollar / U.S. Dollar (NZDUSD) – TradingLounge Day Chart

New Zealand Dollar / U.S. Dollar Day Chart Analysis

NZDUSD Elliott Wave Technical Analysis

Function: Bullish Trend

Mode: Impulsive

Structure: Navy Blue Wave 1

Position: Gray Wave 1

Next Higher Degree Direction: Navy Blue Wave 1 (Started)

Details:

  • Navy Blue Wave 1 within Gray Wave 1 indicates a new bullish trend initiation.
  • Wave cancellation invalid level: 0.55406

NZDUSD Elliott Wave Analysis Overview

The daily NZDUSD Elliott Wave analysis presents a comprehensive technical outlook on the New Zealand Dollar / US Dollar currency pair, focusing on current market structure and trend direction.

Market Trend & Structure

  • The analysis identifies the market as being in a bullish phase, suggesting strong upside momentum.

  • The impulsive structure indicates a sustained upward trend, distinguishing it from corrective or range-bound movements.
  • The price movement is categorized as Navy Blue Wave 1, which is developing within Gray Wave 1, forming part of a larger Elliott Wave cycle.

Key Observations

  • Navy Blue Wave 1 within Gray Wave 1 is unfolding, marking the beginning of a bullish cycle.

  • The next higher-degree trend aligns with Navy Blue Wave 1, supporting an extended bullish move.
  • Wave invalidation level at 0.55406 is crucial—if the price dips below this level, the current wave structure is invalidated, prompting a reassessment.

Conclusion

NZDUSD is currently in an impulsive bullish phase, defined by Navy Blue Wave 1, forming a key part of the larger structure within Gray Wave 1. This phase signals a potential upward trend continuation, making it an important period for traders.

The critical invalidation level at 0.55406 serves as a reference point for confirming wave structure integrity. This Elliott Wave analysis provides a structured framework for understanding NZDUSD’s current position and anticipating future price movements within the bullish trend.

NZDUSD-1D-Forex-Char...


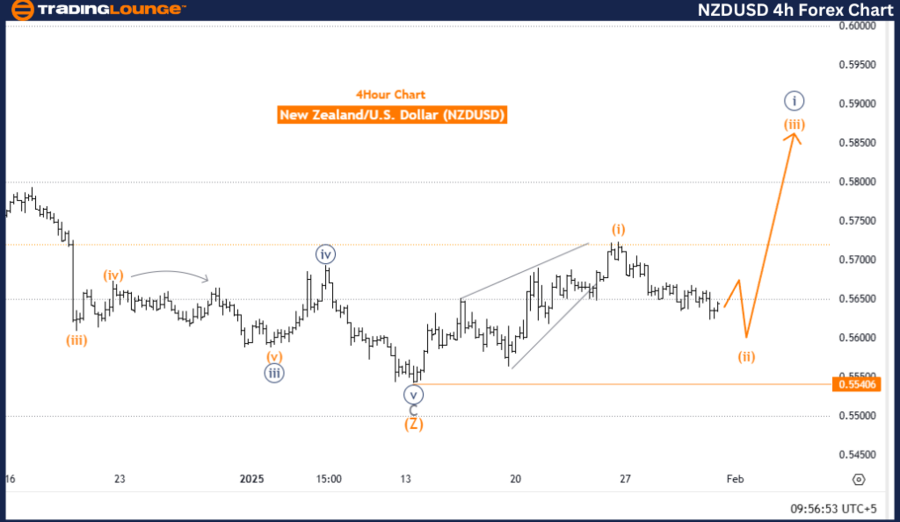
New Zealand Dollar / U.S. Dollar (NZDUSD) – 4-Hour Chart

NZDUSD Elliott Wave Technical Analysis

Function: Counter-Trend

Mode: Corrective

Structure: Orange Wave 2

Position: Navy Blue Wave 1

Next Higher Degree Direction: Orange Wave 3

Details:

  • Orange Wave 1 within Navy Blue Wave 1 appears to have completed.
  • Orange Wave 2 is currently forming as a corrective phase.
  • Wave cancellation invalid level: 0.55406

NZDUSD Elliott Wave Analysis Overview

The 4-hour NZDUSD Elliott Wave analysis provides a short-term technical perspective, focusing on corrective structures and potential trend reversals within the currency pair.

Market Trend & Structure

  • The market is in a counter-trend phase, indicating a temporary price retracement within the larger bullish movement.

  • The corrective structure suggests the market is undergoing a pullback before potentially resuming its primary trend direction.
  • The current wave labeling is Orange Wave 2, which is unfolding within Navy Blue Wave 1, forming part of a larger Elliott Wave cycle.

Key Observations

  • Orange Wave 1 of Navy Blue Wave 1 has completed, with Orange Wave 2 now developing.

  • This corrective phase should be closely watched, as it may provide entry opportunities for traders looking to align with the broader trend.
  • The next expected movement is Orange Wave 3, which typically indicates a strong price rally following the correction.
  • The wave cancellation level at 0.55406 serves as a critical marker—if the price falls below this level, the wave count becomes invalid and requires reevaluation.

Conclusion

NZDUSD is currently in a corrective phase labeled as Orange Wave 2, forming part of a broader counter-trend movement within Navy Blue Wave 1. Once this phase completes, the market is anticipated to shift into Orange Wave 3, which may trigger a renewed upward push.

Traders should monitor the completion of the corrective phase and pay close attention to the invalidation level at 0.55406 to validate the wave count. This Elliott Wave framework offers valuable insights for assessing the market’s current trajectory and preparing for potential future price actions.

Technical Analyst: Malik Awais

Source: visit Tradinglounge.com and learn From the Experts Join TradingLounge Here 

Previous: EURUSD Elliott Wave Technical Analysis

VALUE Offer - Buy 1 Month & Get 3 Months!Click here

Access 7 Analysts Over 200 Markets Covered. Chat Room With Support

NZDUSD-4h-Forex-Char...

Related

U.S.Dollar/Swiss Franc (USD/CHF)  Forex Elliott Wave Technical Analysis and USDCHF Currency Pair

U.S.Dollar/Swiss Franc (USD/CHF)  Forex Elliott Wave Technical Analysis and USDCHF Currency Pair

This detailed article provides an insightful Elliott Wave analysis of the USD/CHF currency pair. Off...

Read More >
DOW JONES - DJI Index Elliott Wave Technical Analysis: Understand how these waves impact Dow Jones trading strategies

DOW JONES - DJI Index Elliott Wave Technical Analysis: Understand how these waves impact Dow Jones trading strategies

This article provides a detailed Elliott Wave analysis for the Dow Jones (DJI) index, covering key m...

Read More >
Polkadot/U.S. dollar(DOTUSD) Elliott Wave Technical Analysis 23 January 24

Polkadot/U.S. dollar(DOTUSD) Elliott Wave Technical Analysis 23 January 24

Polkadot and U.S. dollar Elliott Wave Technical Analysis dated 23 January 24, DOTUSD Elliott Wave Te...

Read More >
Australian Dollar / Japanese Yen (AUDJPY) Forex Elliott Wave Technical Analysis: Insights and Predictions

Australian Dollar / Japanese Yen (AUDJPY) Forex Elliott Wave Technical Analysis: Insights and Predictions

Elliott Wave analysis of the AUDJPY currency pair, detailing both daily and 4-hour chart interpretat...

Read More >
Explore CBA's stock performance: Elliott Wave forecast for the Commonwealth Bank of Australia (CBA) on the ASX

Explore CBA's stock performance: Elliott Wave forecast for the Commonwealth Bank of Australia (CBA) on the ASX

This analysis provides an in-depth Elliott Wave forecast for the Commonwealth Bank of Australia (CBA...

Read More >
Navigating Market Trends: Apple Inc. Elliott Wave Technical Analysis and AAPL market dynamics

Navigating Market Trends: Apple Inc. Elliott Wave Technical Analysis and AAPL market dynamics

Delve into the latest AAPL market dynamics with our detailed Elliott Wave analysis. Gain insights in...

Read More >

Buy 1 Month

Get 3 Months!

Special Offer:

Trade Recommendations

Unleash the power of deversified trading with our comprehensive portfolio, covering:

  • Stock Trades
  • Crypto Trades
  • Forex Trades
  • Commodity Trades
Elliott Wave Analysis

Gain a competive edge with expert insights in to:

  • Global Indices
  • US Stocks & ASX Stocks
  • Forex & Crypto
  • Commodities
Top-Notch Trading Tools

Equip yourself with the tools of success:

  • Social Chat
  • Elliott Wave Algorithm
  • Screener
  • TradingLevels
  • Trading Game
7 Elliott Wave Analysts

Stay ahead of the market with daily charts and insightful videos
-Your secret to strategic trading!

JOIN HERE


Welcome to TradingLounge (ASIC A.R.No. 321187), specialists in trades, trading education and technical analysis, covering stocks, indices, commodities, forex and cryptocurrencies.

When you join TradingLounge you have access to everything we offer, including trade tools, educational content and a social platform to chat with like-minded investors.

Read more

@Copyright 2024 by tradinglounge.com

Contact Us

Australian no: 02 4787 6020

International no: +61 (2) 47876020

Pay with:

Find us on