12May

Mastercard Inc. (MA) Elliott Wave Analysis Reveals Bullish Momentum with Anticipated Resistance at $650

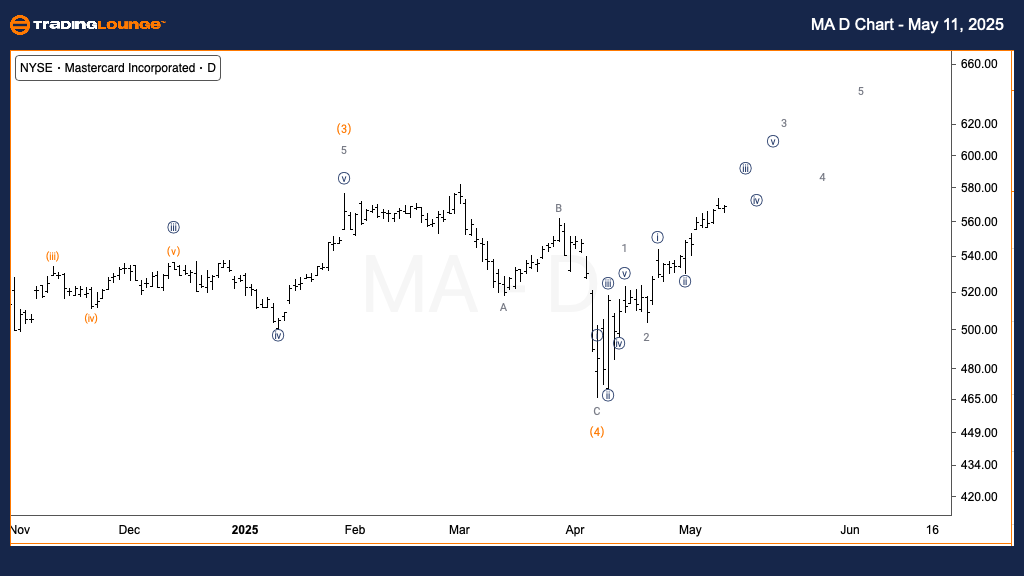
Mastercard Inc. (MA) Elliott Wave Analysis - TradingLounge Daily Chart

MA Elliott Wave Technical Analysis

FUNCTION: Trend

MODE: Impulsive

STRUCTURE: Motive

POSITION: Wave 3

DIRECTION: Upside in wave 3

DETAILS: Minor wave 3 is progressing higher as Mastercard approaches its previous all-time high (ATH). A key technical resistance zone lies near $650, which could act as the potential termination point of wave 3.

Mastercard Inc. (NYSE: MA) shows continued bullish momentum on the daily chart within an Elliott Wave impulsive structure. The stock is currently advancing in Minor wave 3, aiming to breach its former ATH. Analysts and traders closely watch the $650 resistance level, as it may represent the peak of this current wave 3. A rejection here could lead to a corrective wave 4, potentially offering a buying opportunity before the next bullish leg begins.

Mastercard-d-chart-1...


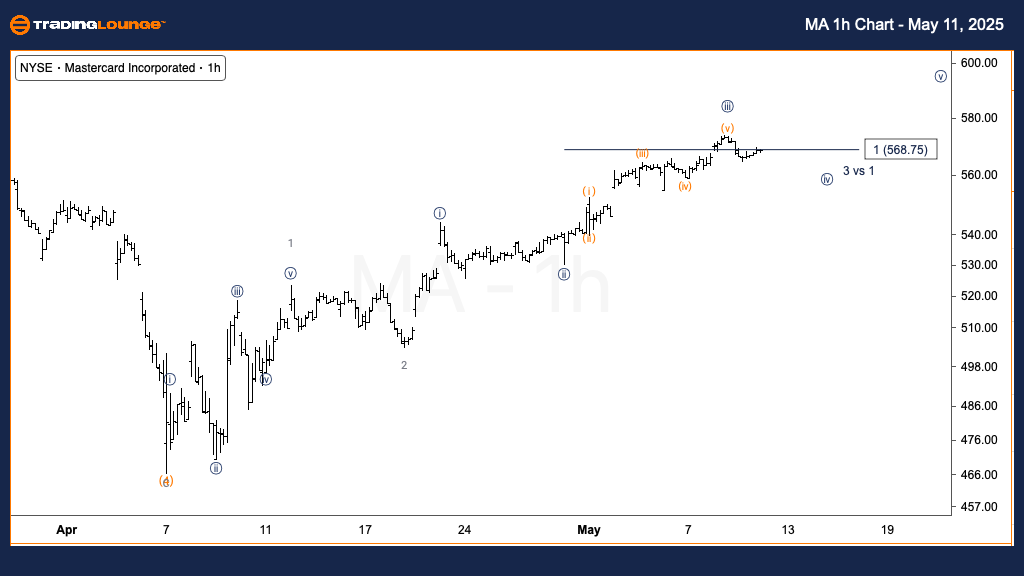
Mastercard Inc. (MA) Elliott Wave Analysis - TradingLounge 1-Hour Chart

MA Elliott Wave Technical Analysis

FUNCTION: Trend

MODE: Impulsive

STRUCTURE: Motive

POSITION: Wave {iii} of 3

DIRECTION: Potential top in wave {iii}

DETAILS: Wave {iii} may be nearing completion, suggesting a probable retracement in wave {iv}. Given the proportionality between waves {i} and {iii}, a possible extension in wave {v} may follow after the pullback.

On the 1-hour chart, Mastercard stock (ticker: MA) appears to be concluding wave {iii} within the broader wave 3 sequence. A short-term decline in wave {iv} could soon develop, consistent with standard Elliott Wave principles. If confirmed, this move would precede a bullish extension in wave {v}, reinforcing the strong uptrend visible on higher timeframes. Traders should monitor this potential setup for a continuation of the upward momentum.

Technical Analyst: Alessio Barretta

Source: Visit Tradinglounge.com and learn from the Experts. Join TradingLounge Here 

Previous: Spotify Technology S.A. (SPOT) Elliott Wave Technical Analysis

VALUE Offer - Buy 1 Month & Get 3 Months!Click here

Access 7 Analysts Over 200 Markets Covered. Chat Room With Support

Mastercard-1h-chart-...

Related

Unlocking the Future of SMCI: Super Micro Computer Inc.(SMCI) Stocks Elliott Wave Technical Analysis

Unlocking the Future of SMCI: Super Micro Computer Inc.(SMCI) Stocks Elliott Wave Technical Analysis

Dive into our comprehensive Elliott Wave analysis of Super Micro Computer Inc. (SMCI). This article ...

Read More >
State Bank of India Stocks Elliott Wave Technical Analysis: Interpret Current Trends and Potential Future Price Movements

State Bank of India Stocks Elliott Wave Technical Analysis: Interpret Current Trends and Potential Future Price Movements

This in-depth technical analysis for the State Bank of India (SBIN) uses the Elliott Wave method to ...

Read More >
Dell Technologies Stock Alert: DELL Elliott Wave Analysis Predicts Further Downside – Bearish Trend and Key Levels to Watch!

Dell Technologies Stock Alert: DELL Elliott Wave Analysis Predicts Further Downside – Bearish Trend and Key Levels to Watch!

Dell Technologies (DELL) is in a corrective phase, forming a five-wave structure within wave C of (4...

Read More >
The Procter & Gamble Company (PG) Elliott Wave Technical Analysis 9 February 24

The Procter & Gamble Company (PG) Elliott Wave Technical Analysis 9 February 24

Delve into the world of trading with a comprehensive analysis of Procter & Gamble (PG) stock using E...

Read More >
Newmont Corporation ASX: NEM Elliott Wave Analysis Reveals Bullish Price Targets and Trading Signals for Gold Stock Investors

Newmont Corporation ASX: NEM Elliott Wave Analysis Reveals Bullish Price Targets and Trading Signals for Gold Stock Investors

Elliott Wave analysis for Newmont Corporation (ASX: NEM), highlighting key price targets, bullish st...

Read More >
Boeing Stock Elliott Wave Analysis: BA Forecast, Wave Count, Chart Structure, Price Targets, and Bullish Trend Outlook Explained

Boeing Stock Elliott Wave Analysis: BA Forecast, Wave Count, Chart Structure, Price Targets, and Bullish Trend Outlook Explained

This article delivers a detailed Elliott Wave forecast for Boeing (BA), featuring both daily and int...

Read More >

Buy 1 Month

Get 3 Months!

Special Offer:

Trade Recommendations

Unleash the power of deversified trading with our comprehensive portfolio, covering:

  • Stock Trades
  • Crypto Trades
  • Forex Trades
  • Commodity Trades
Elliott Wave Analysis

Gain a competive edge with expert insights in to:

  • Global Indices
  • US Stocks & ASX Stocks
  • Forex & Crypto
  • Commodities
Top-Notch Trading Tools

Equip yourself with the tools of success:

  • Social Chat
  • Elliott Wave Algorithm
  • Screener
  • TradingLevels
  • Trading Game
7 Elliott Wave Analysts

Stay ahead of the market with daily charts and insightful videos
-Your secret to strategic trading!

JOIN HERE


Welcome to TradingLounge (ASIC A.R.No. 321187), specialists in trades, trading education and technical analysis, covering stocks, indices, commodities, forex and cryptocurrencies.

When you join TradingLounge you have access to everything we offer, including trade tools, educational content and a social platform to chat with like-minded investors.

Read more

@Copyright 2024 by tradinglounge.com

Contact Us

Australian no: 02 4787 6020

International no: +61 (2) 47876020

Pay with:

Find us on