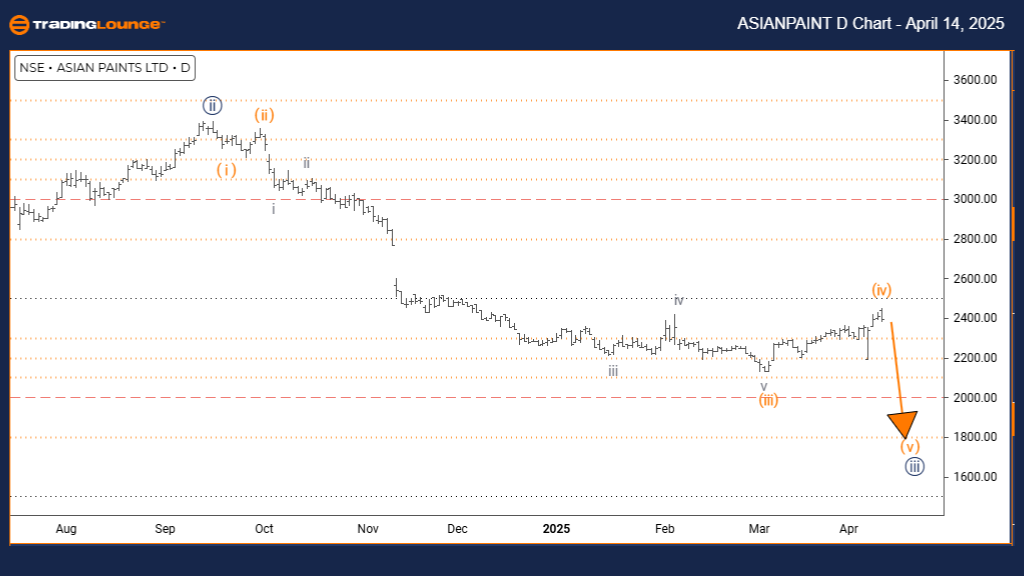
ASIAN PAINTS Elliott Wave Analysis – TradingLounge Daily Chart
ASIAN PAINTS Daily Chart Analysis
ASIAN PAINTS Elliott Wave Technical Analysis
FUNCTION: Counter Trend
MODE: Impulsive
STRUCTURE: Orange Wave 5
POSITION: Navy Blue Wave 3
DIRECTION NEXT HIGHER DEGREES: Navy Blue Wave 4
DETAILS: Orange wave 4 looks complete; orange wave 5 is currently unfolding.
Asian Paints’ daily Elliott Wave chart reveals a counter-trend rally within a broader impulsive wave sequence. The completion of orange wave 4 marks the beginning of orange wave 5, which is positioned inside a larger navy blue wave 3 pattern. This signals the final thrust of the current upward phase within an overarching corrective framework.
Orange wave 5 typically represents the final leg of an impulse wave, often characterized by a strong price push before a trend reversal. The end of wave 4 sets the stage for this final move. Current price behavior hints that wave 5 may be progressing toward its peak, with momentum indicators suggesting a potential exhaustion phase.
Once orange wave 5 concludes, a corrective navy blue wave 4 is expected to emerge. This wave should offer a retracement or consolidation, acting as a pause in the larger trend. The daily chart structure highlights the importance of this phase in concluding the rally, offering potential trade adjustment points.
Traders should monitor orange wave 5 for classic completion signals such as divergence on momentum oscillators or clear reversal candlestick patterns. This wave, being the final stage of the impulse, presents a critical zone for managing or exiting trades within the counter-trend move.
The Elliott Wave outlook recommends preparing for a possible trend shift as orange wave 5 nears its conclusion. However, extended waves can stretch the trend, so traders should confirm with price patterns and technical analysis tools. Upcoming trading sessions will be key in determining whether the upward rally is ending and a corrective phase is beginning.
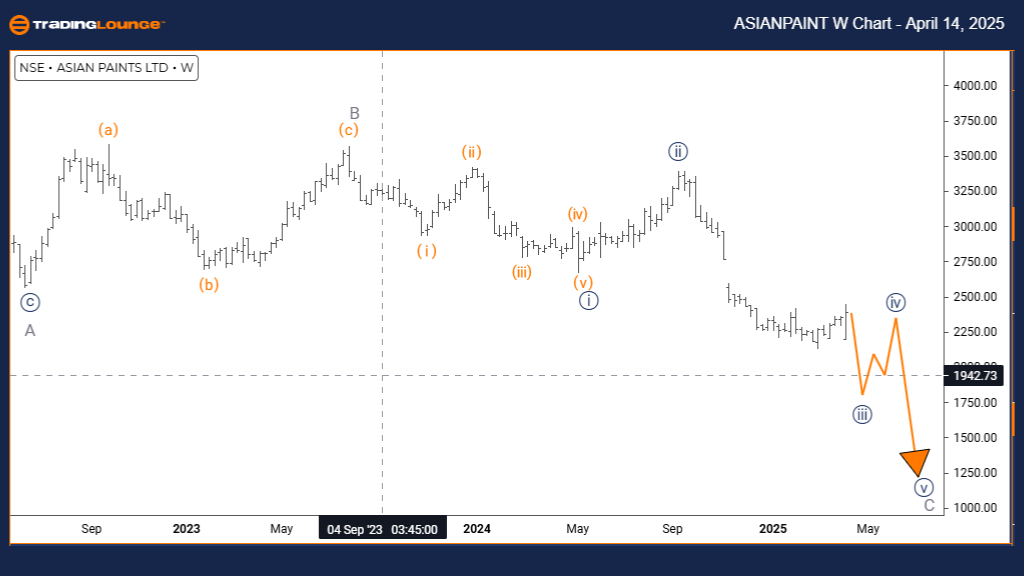
ASIAN PAINTS Elliott Wave Analysis – TradingLounge Weekly Chart
ASIAN PAINTS Elliott Wave Technical Analysis
FUNCTION: Counter Trend
MODE: Impulsive
STRUCTURE: Navy Blue Wave 3
POSITION: Gray Wave C
DIRECTION NEXT HIGHER DEGREES: Navy Blue Wave 4
DETAILS: Navy blue wave 2 is likely complete; navy blue wave 3 is unfolding.
Asian Paints' weekly Elliott Wave chart shows a counter-trend rally within an impulsive pattern, following the completion of navy blue wave 2. The price is now advancing through navy blue wave 3, part of the broader gray wave C formation. This suggests a strong bullish move within a corrective trend seen on higher timeframes.
Wave 3 is typically the most dynamic and extended wave in an Elliott sequence, often marked by powerful momentum and price expansion. With wave 2 complete, wave 3 is actively driving the rally, potentially exceeding the length of wave 1. The current setup favors continued upside until this impulse wave matures.
Once navy blue wave 3 reaches completion, navy blue wave 4 is expected to unfold as a corrective wave. This should offer a pullback opportunity, providing traders with potential entry or exit points. The weekly timeframe adds clarity to the medium-term outlook, showing the stock in a pivotal stage of a larger corrective structure.
Traders should analyze wave 3 for signs of impulsive behavior, such as strong volume, clear price trends, and minimal retracement. As part of a counter-trend rally, this wave may extend significantly before wave 4 correction begins. Technical indicators and volume patterns will help confirm the strength and possible end of the wave.
This analysis anticipates further gains during the navy blue wave 3 progression before a pause in wave 4. Monitoring Fibonacci levels and price action can help identify reversal zones. While the rally is part of a corrective trend, the current structure suggests meaningful upside potential. Traders should stay alert for high-probability setups and potential trend shifts.
Technical Analyst: Malik Awais
Source: visit Tradinglounge.com and learn From the Experts Join TradingLounge Here
Previous: TECH MAHINDRA Elliott Wave Technical Analysis
VALUE Offer - Buy 1 Month & Get 3 Months!Click here
Access 7 Analysts Over 200 Markets Covered. Chat Room With Support