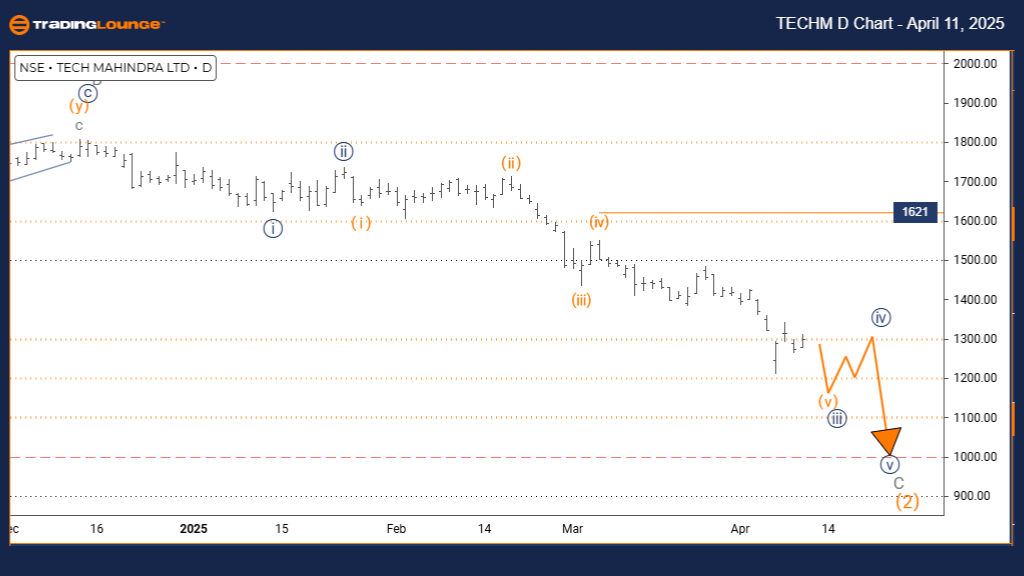
TECH MAHINDRA Elliott Wave Analysis – Trading Lounge Day Chart
TECH MAHINDRA Elliott Wave Technical Analysis
Function: Counter Trend
Mode: Impulsive
Structure: Navy Blue Wave 3
Position: Gray Wave C
Direction (Next Higher Degrees): Navy Blue Wave 4
Details: Completion of Navy Blue Wave 2 confirmed; Navy Blue Wave 3 of C is developing.
Invalidation Level: 1621
Tech Mahindra’s daily chart, analyzed through Elliott Wave theory, suggests a counter-trend impulsive pattern in progress. After successfully finalizing Navy Blue Wave 2, the price has entered Navy Blue Wave 3, which sits within the broader Gray Wave C corrective phase.
Wave 3, traditionally the strongest segment in an Elliott Wave pattern, is expected to show sustained upward momentum and rising price levels. Its current development indicates a critical part of the broader correction. As this wave progresses, it should be watched closely for continuation signals.
Following the completion of Wave 3, the chart anticipates a pullback via Navy Blue Wave 4, offering potential trade setups. Key tools for analyzing the end of Wave 3 include Fibonacci extension levels. 1621 remains the vital support and invalidation level—any drop below this would invalidate the current wave count.
The current impulsive rally shows increasing volume and momentum, typical traits of a developing Wave 3. Technical traders should monitor this wave for consistent patterns: strong momentum, volume expansion, and stable upward price action.
Managing trades during this wave involves tight risk controls centered around the 1621 invalidation level. The impulsive characteristics suggest continued price strength unless structural signs indicate otherwise.
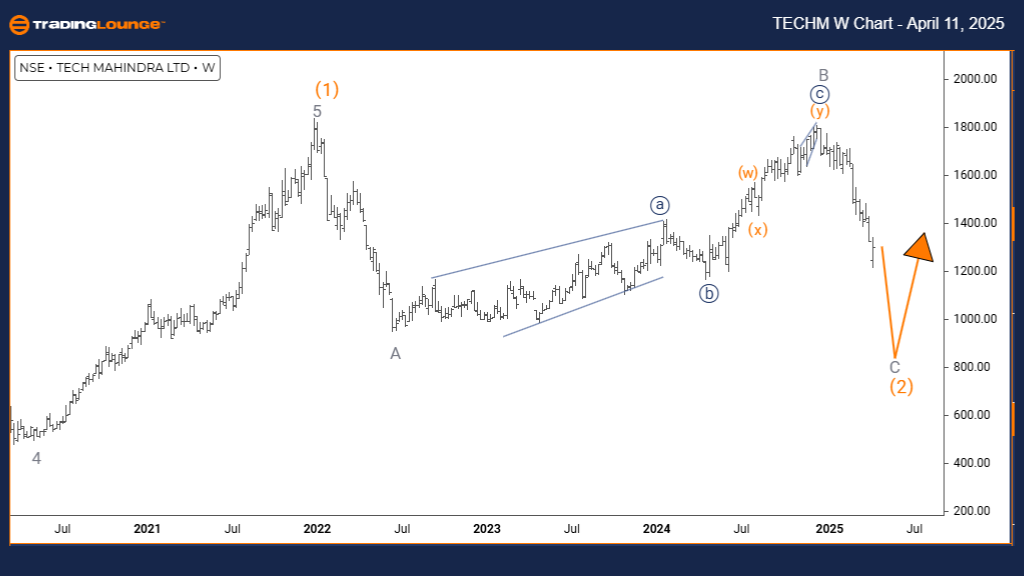
TECH MAHINDRA Elliott Wave Analysis – Trading Lounge Weekly Chart
TECH MAHINDRA Elliott Wave Technical Analysis
Function: Counter Trend
Mode: Impulsive
Structure: Gray Wave C
Position: Orange Wave 2
Direction (Next Higher Degrees): Orange Wave 3
Details: Completion of Gray Wave B confirmed; Gray Wave C of 2 now active.
The weekly chart of Tech Mahindra, based on Elliott Wave technical analysis, reveals that Gray Wave B of 2 is complete. The current movement is forming Gray Wave C of 2, situated inside the Orange Wave 2 corrective structure. This structure highlights a counter-trend impulsive move with notable directional intent.
Gray Wave C, typically the final and strongest part of a corrective wave, may retest or exceed prior lows. Once it concludes, a new impulsive phase—Orange Wave 3—is expected, potentially launching a strong price advance and trend shift.
Orange Wave 3 is projected to be powerful and impulsive at its degree, providing high-reward trade opportunities. Traders should observe end-of-wave signals, such as Fibonacci targets or recognizable Elliott patterns, for signs of a shift in trend.
This longer-term chart outlines an intermediate correction phase before a major trend resumption. The ongoing impulsive behavior in Wave C suggests there could be valuable setups for positioning ahead of Wave 3’s launch.
Using volume trends and momentum indicators can help confirm when Gray Wave C ends. The outlook favors preparing for a transition into Orange Wave 3, while remaining cautious of possible wave extensions and ongoing volatility.
Technical Analyst: Malik Awais
Source: visit Tradinglounge.com and learn From the Experts Join TradingLounge Here
Previous: ITC INDIA Elliott Wave Technical Analysis
VALUE Offer - Buy 1 Month & Get 3 Months!Click here
Access 7 Analysts Over 200 Markets Covered. Chat Room With Support