10Apr

ITC Stock Elliott Wave Analysis: Forecasting Share Price Correction in Wave C and Strategic Trading Setup for FMCG Investors

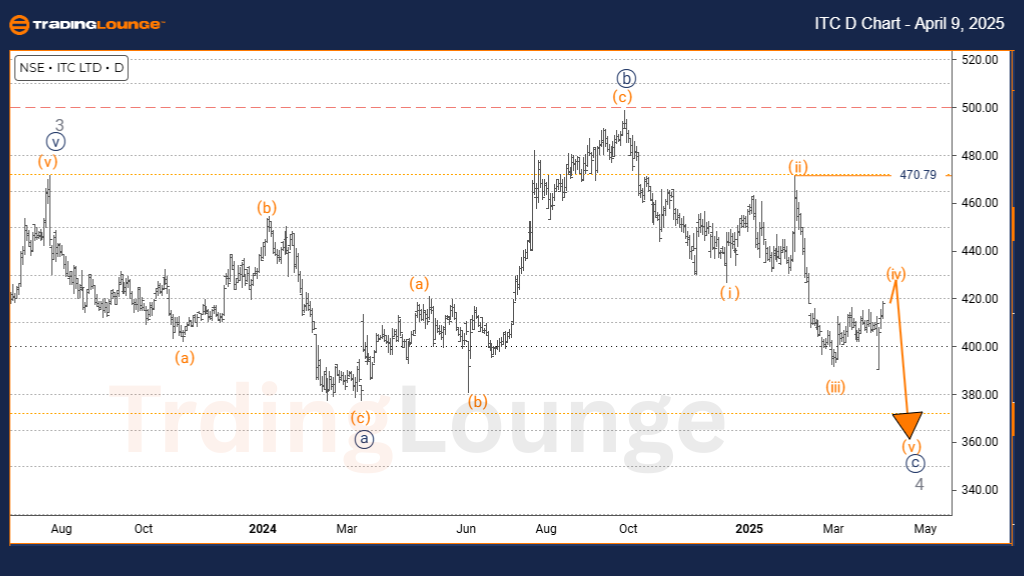
ITC INDIA Elliott Wave Analysis Trading Lounge Day Chart

ITC INDIA Stock Day Chart Analysis

ITC INDIA Elliott Wave Technical Analysis

FUNCTION: Counter Trend

MODE: Corrective

STRUCTURE: Navy blue wave C

POSITION: Gray wave 4

DIRECTION NEXT HIGHER DEGREES: Gray wave 5

DETAILS: Navy blue wave B appears complete, with navy blue wave C now unfolding.

Wave Cancel Invalid Level: 470.79

The ITC INDIA Elliott Wave Analysis on the daily chart highlights a corrective phase within the broader Elliott Wave structure, identifying a counter-trend move for this leading FMCG stock. The current setup places focus on navy blue wave C, developing within gray wave 4, signaling a potential short-term decline ahead of a bullish continuation.

With navy blue wave B concluded, the transition into navy blue wave C suggests the stock is experiencing a temporary pause before the start of gray wave 5. This scenario implies that ITC may offer short-term trading opportunities during the correction, while maintaining a longer-term bullish outlook.

Key support lies at 470.79, which is the wave count invalidation level. A break below this level would negate the current wave structure and require a reassessment of the pattern. Traders should monitor for classic corrective patterns, such as ABC zigzags or sideways ranges, to align with wave expectations. Once wave C finalizes, gray wave 5 could resume the primary upward trend, presenting strong potential for trend-following trades.

ITC-INDIA-Srock-Day-...


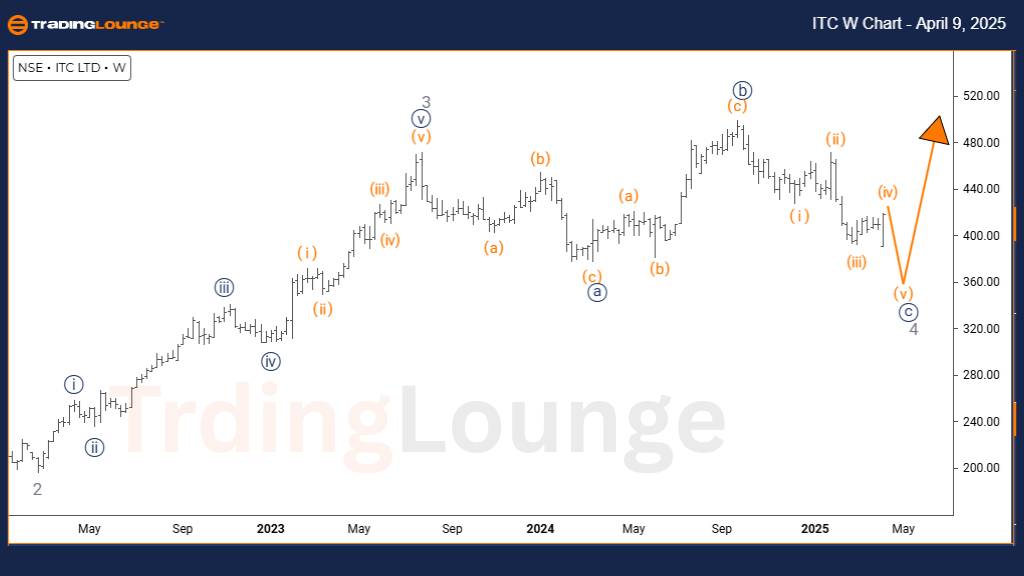
ITC INDIA Elliott Wave Analysis Trading Lounge Weekly Chart

ITC INDIA Elliott Wave Technical Analysis

FUNCTION: Counter Trend

MODE: Corrective

STRUCTURE: Navy blue wave C

POSITION: Gray wave 4

DIRECTION NEXT HIGHER DEGREES: Gray wave 5

DETAILS: Navy blue wave B appears complete, and navy blue wave C is currently in progress.

Wave Cancel Invalid Level: 470.79

The ITC INDIA Elliott Wave Analysis on the weekly chart presents a broader corrective structure in motion, with the stock navigating through navy blue wave C of gray wave 4. This wave count suggests a medium-term pullback within the prevailing uptrend, offering insight into possible entry setups ahead of gray wave 5's impulsive phase.

With the completion of navy blue wave B, the progression into wave C underscores the importance of understanding wave relationships across timeframes. The 470.79 level acts as a crucial invalidation point for this wave scenario. Breaching this threshold would challenge the integrity of the current analysis, signaling an alternate pattern could be at play.

This weekly Elliott Wave outlook provides a strategic roadmap for position traders, enabling a broader perspective on market corrections and trend resumption potential. As wave C evolves, traders should stay alert to corrective patterns and prepare for the transition into gray wave 5, which could restore bullish momentum. The chart signals short-term weakness but also hints at longer-term growth opportunities, reinforcing ITC's place within a maturing Elliott Wave cycle.

Technical Analyst: Malik Awais

Source: visit Tradinglounge.com and learn From the Experts Join TradingLounge Here 

Previous: COAL INDIA Elliott Wave Technical Analysis

VALUE Offer - Buy 1 Month & Get 3 Months!Click here

Access 7 Analysts Over 200 Markets Covered. Chat Room With Support

ITC-INDIA-Stock-Week...

Related

Watch The Ongoing Developments in Hero MotoCorp’s Share Price: HERO Stocks Elliott Wave Technical Analysis

Watch The Ongoing Developments in Hero MotoCorp’s Share Price: HERO Stocks Elliott Wave Technical Analysis

Explore the latest Hero MotoCorp stock analysis using Elliott Wave theory and technical indicators. ...

Read More >
Expert Analysis Covers BNBUSD Elliott Wave Analysis, Binance Coin Price Predictions and BNBUSD Technical Analysis

Expert Analysis Covers BNBUSD Elliott Wave Analysis, Binance Coin Price Predictions and BNBUSD Technical Analysis

Discover comprehensive BNBUSD Elliott Wave Analysis and Binance Coin price predictions. Our expert a...

Read More >
Amazon Inc. (AMZN) Elliott Wave Analysis: Amazon Stock Forecast, Market Trends, Trading Strategies, and Investment Insights

Amazon Inc. (AMZN) Elliott Wave Analysis: Amazon Stock Forecast, Market Trends, Trading Strategies, and Investment Insights

Elliott Wave analysis of Amazon (AMZN) stock, including insights into current market trends, wave pa...

Read More >
Swiss Market Index (SMI) Elliott Wave Analysis – Bullish Trend, Forecast, Technical Chart, Price Prediction, and Stock Market Outlook

Swiss Market Index (SMI) Elliott Wave Analysis – Bullish Trend, Forecast, Technical Chart, Price Prediction, and Stock Market Outlook

The Swiss Market Index (SMI) continues its bullish Elliott Wave trend, with impulsive wave formation...

Read More >
ASX RIO's Stock Performance and Future Movements - RIO TINTO LIMITED Elliott Wave Technical Analysis

ASX RIO's Stock Performance and Future Movements - RIO TINTO LIMITED Elliott Wave Technical Analysis

Our comprehensive Elliott Wave analysis of ASX: RIO TINTO LIMITED - RIO provides an in-depth look at...

Read More >
Avery Dennison Corp. (AVY) Elliott Wave Analysis Predicts Bullish Wave 3 Breakout with Strong Technical Chart Setup for Traders

Avery Dennison Corp. (AVY) Elliott Wave Analysis Predicts Bullish Wave 3 Breakout with Strong Technical Chart Setup for Traders

AVY appears to be entering a strong bullish phase in Wave 3 per Elliott Wave analysis. A breakout co...

Read More >

$1 for 2 Weeks

then $29 a month!

What a Special Offer!

Trade Recommendations

Unleash the power of deversified trading with our comprehensive portfolio, covering 250+ markets:

  • Stock Trades
  • Crypto Trades
  • Forex Trades
  • Commodity Trades
Elliott Wave Analysis

Gain a competitive edge with expert insights and AI-powered Elliott Wave charting into:

  • Global Indices
  • US Stocks & ASX Stocks
  • Forex & Crypto
  • Commodities
Top-Notch Trading Tools

Equip yourself with the tools of success:

  • Real-time Chat rooms
  • Elliott Wave Algorithm
  • Portfolio tools
  • TradingLevels
  • Screener
  • Trading Game
7 Elliott Wave Analysts

Stay ahead of the market with daily charts and insightful videos
Your secret to strategic trading!

JOIN HERE


Welcome to TradingLounge (ASIC A.R.No. 321187), specialists in trades, trading education and technical analysis, covering stocks, indices, commodities, forex and cryptocurrencies.

When you join TradingLounge you have access to everything we offer, including trade tools, educational content and a social platform to chat with like-minded investors.

Read more

@Copyright 2024 by tradinglounge.com

Contact Us

Australian no: 02 4787 6020

International no: +61 (2) 47876020

Pay with:

Find us on