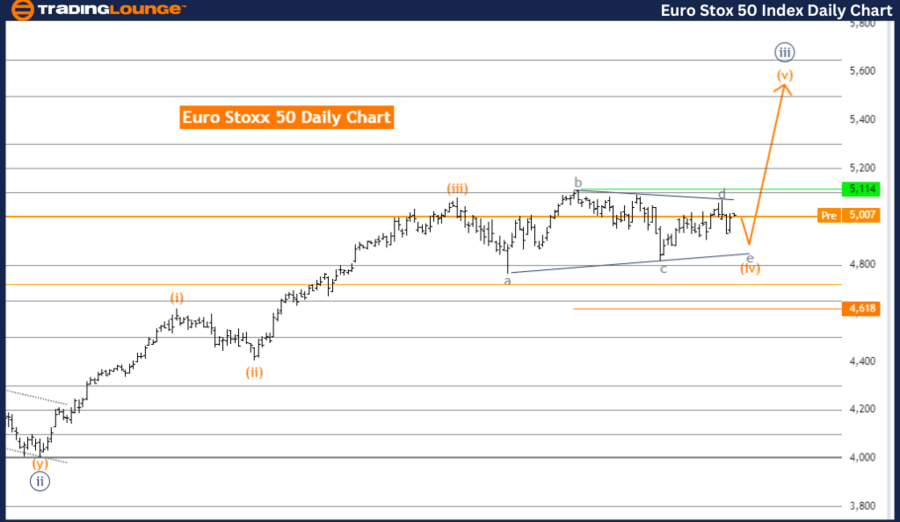
Euro Stoxx 50 Elliott Wave Analysis - Daily Chart

Overview

The Euro Stoxx 50 Elliott Wave analysis on the daily chart highlights a counter-trend within a corrective mode.

Trend Identification

  • Function: Counter Trend
  • Mode: Corrective
  • Structure: Orange wave 4
  • Position: Navy blue wave 3

Current Analysis

  • Details: Orange wave 4 continues to exhibit sideways movement.
  • Invalidation Level: 4618

Key Points

  • Corrective Counter Trend: The analysis points to a corrective trend, signifying a consolidation phase against the primary trend.

  • Wave Structure: Focus is on orange wave 4 within the Elliott Wave structure, positioned within navy blue wave 3, indicating a corrective phase.
  • Next Phase: The subsequent phase in the wave structure is orange wave 5, which may either resume the primary trend or extend the correction.

Detailed Analysis

  • Sideways Movement: Orange wave 4 is characterized by a lack of clear directional bias and range-bound market behavior.
  • Wave 4 Characteristics: The ongoing orange wave 4 reflects a period of fluctuation without a strong upward or downward trend.
  • Invalidation Level: Set at 4618, this level is crucial; surpassing it would invalidate the current wave analysis, indicating a significant market shift.

Conclusion

The Euro Stoxx 50 daily chart analysis identifies a counter trend within the Elliott Wave framework. The market is in the corrective phase of orange wave 4 within navy blue wave 3, marked by sideways movement. This phase is ongoing, with the next phase being Orange Wave 5. The invalidation level at 4618 is essential for confirming the current wave structure.

Euro-Stoxx-50-Index-...


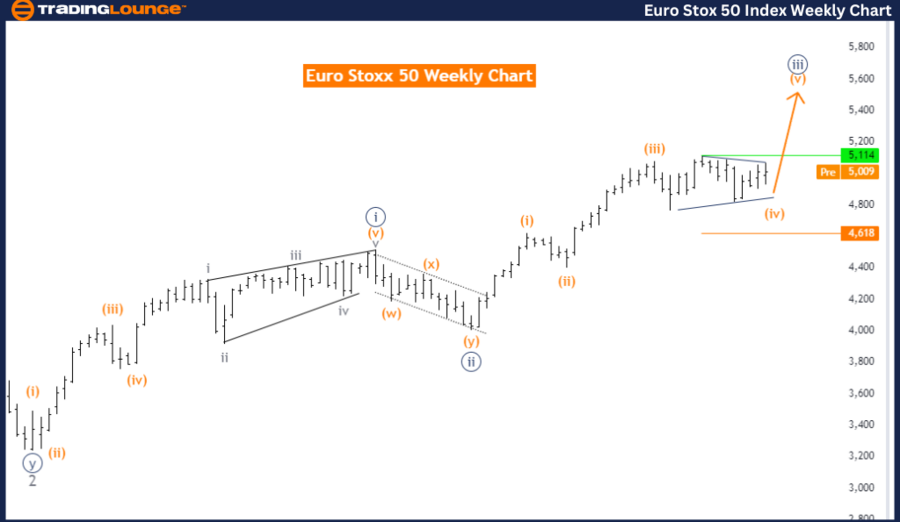
Euro Stoxx 50 Elliott Wave Analysis - Weekly Chart

Overview

The Euro Stoxx 50 Elliott Wave analysis on the weekly chart highlights a strong trend within an impulsive mode.

Trend Identification

  • Function: Trend
  • Mode: Impulsive
  • Structure: Navy blue wave 3
  • Position: Gray wave 3

Current Analysis

  • Details: Navy blue wave 3 is currently in progress.
  • Invalidation Level: 4618

Key Points

  • Impulsive Trend: The analysis identifies an impulsive trend, indicating strong directional movements.

  • Wave Structure: Focus is on navy blue wave 3 within the Elliott Wave structure, positioned within gray wave 3, suggesting a robust upward trend.
  • Next Phase: The next anticipated phase is Navy Blue Wave 4, typically representing a corrective phase.

Detailed Analysis

  • Navy Blue Wave 3: This wave is characterized by strong upward movement, indicative of a robust market trend.

  • Next Expected Phase: Navy Blue Wave 4 is anticipated to follow, marking a corrective phase with potential retracement against the prevailing trend before resuming upward movement.
  • Invalidation Level: Set at 4618, surpassing this level would invalidate the current wave analysis, indicating significant market changes.

Conclusion

The Euro Stoxx 50 weekly chart analysis highlights an impulsive trend within the Elliott Wave framework. The market is in the upward phase of navy blue wave 3 within gray wave 3, showing strong bullish momentum. The next phase is expected to be Navy Blue Wave 4, involving a corrective retracement. The invalidation level at 4618 is critical for confirming the current wave structure.

Technical Analyst: Malik Awais

Source: visit Tradinglounge.com and learn From the Experts Join TradingLounge Here 

See previous: Swiss Market Index Elliott Wave Technical Analysis

Special Trial Offer - 0.76 Cents a Day for 3 Months! Click here

Access 7 Analysts Over 170 Markets Covered. Chat Room With Support

Euro-Stoxx-50-Index-...

Related

NEWMONT CORPORATION - NEM Elliott Wave Forecast Reveals Stock Price Targets, and Trading Strategy for Gold Stock Investors

NEWMONT CORPORATION - NEM Elliott Wave Forecast Reveals Stock Price Targets, and Trading Strategy for Gold Stock Investors

Elliott Wave technical analysis for ASX:NEM, identifying key price targets, validation points, and s...

Read More >
ASX: BLOCK INC (SQ2) Elliott Wave Stock Forecast with Key Support and Trading Strategy for Bullish Wave (3) Setup

ASX: BLOCK INC (SQ2) Elliott Wave Stock Forecast with Key Support and Trading Strategy for Bullish Wave (3) Setup

ASX: BLOCK INC (SQ2) shows bullish potential under Elliott Wave analysis. Stay above 76.54 for wave ...

Read More >
ASX Sonic Healthcare Limited SHL Elliott Wave Analysis: Price Prediction, Key Resistance & Support Levels for Bullish Breakout

ASX Sonic Healthcare Limited SHL Elliott Wave Analysis: Price Prediction, Key Resistance & Support Levels for Bullish Breakout

Elliott Wave analysis on ASX: SHL highlights potential bullish trends for Sonic Healthcare Limited. ...

Read More >
VeChian Crypto Trading Strategy: Focusing on VeChain's Price Prediction and VETUSD Elliott Wave Technical Analysis

VeChian Crypto Trading Strategy: Focusing on VeChain's Price Prediction and VETUSD Elliott Wave Technical Analysis

This article provides a comprehensive VETUSD Elliott Wave analysis, focusing on VeChain's price ...

Read More >
Understanding Daily and 4Hr Chart Trends: UnitedHealth Group Inc. (UNH) Elliott Wave Technical Analysis

Understanding Daily and 4Hr Chart Trends: UnitedHealth Group Inc. (UNH) Elliott Wave Technical Analysis

UnitedHealth Group Inc. (UNH) presents intriguing opportunities for traders amidst its ongoing corre...

Read More >

$1 for 2 Weeks

then $29 a month!

What a Special Offer!

Trade Recommendations

Unleash the power of deversified trading with our comprehensive portfolio, covering 250+ markets:

  • Stock Trades
  • Crypto Trades
  • Forex Trades
  • Commodity Trades
Elliott Wave Analysis

Gain a competitive edge with expert insights and AI-powered Elliott Wave charting into:

  • Global Indices
  • US Stocks & ASX Stocks
  • Forex & Crypto
  • Commodities
Top-Notch Trading Tools

Equip yourself with the tools of success:

  • Real-time Chat rooms
  • Elliott Wave Algorithm
  • Portfolio tools
  • TradingLevels
  • Screener
  • Trading Game
7 Elliott Wave Analysts

Stay ahead of the market with daily charts and insightful videos
Your secret to strategic trading!

JOIN HERE


Welcome to TradingLounge (ASIC A.R.No. 321187), specialists in trades, trading education and technical analysis, covering stocks, indices, commodities, forex and cryptocurrencies.

When you join TradingLounge you have access to everything we offer, including trade tools, educational content and a social platform to chat with like-minded investors.

Read more

@Copyright 2024 by tradinglounge.com

Contact Us

Australian no: 02 4787 6020

International no: +61 (2) 47876020

Pay with:

Find us on