18Jul

NEWMONT CORPORATION - NEM Elliott Wave Forecast Reveals Stock Price Targets, and Trading Strategy for Gold Stock Investors

ASX: NEWMONT CORPORATION - NEM Elliott Wave Technical Analysis

Greetings,

This Elliott Wave technical analysis focuses on NEWMONT CORPORATION (ASX:NEM), listed on the Australian Stock Exchange. According to the current wave structure, ASX:NEM is advancing in wave three, showing a motive pattern with a strong bullish trend. We include precise price targets and invalidation levels to support trading decisions and validate the Elliott Wave count.


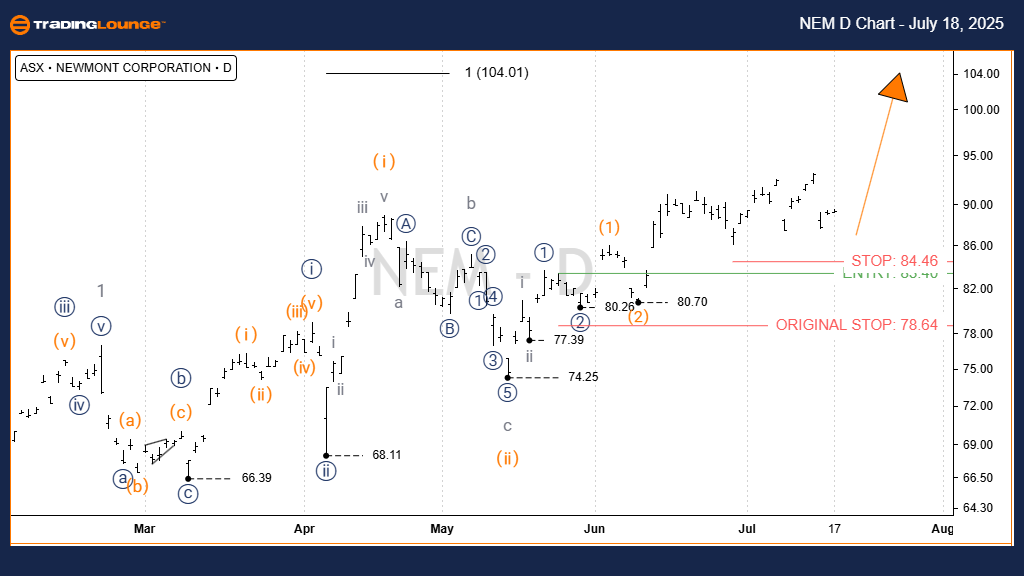
ASX: NEWMONT CORPORATION - NEM Elliott Wave Technical Analysis (1D Semilog Chart)

Function: Primary trend (Minor degree, grey)

Mode: Motive

Structure: Impulse

Current Position: Wave iii) orange of Wave iii)) navy of Wave 3 grey

Technical Overview:

Wave ii) orange most likely concluded around the 74.25 low, forming a classic a-b-c zigzag (grey).

Since then, Wave iii) orange has moved upward aggressively, aiming for a target near 100.00.

Invalidation Level: A decline below 74.25 would invalidate the current count.

NEM-Asx-d-Chart-1807...


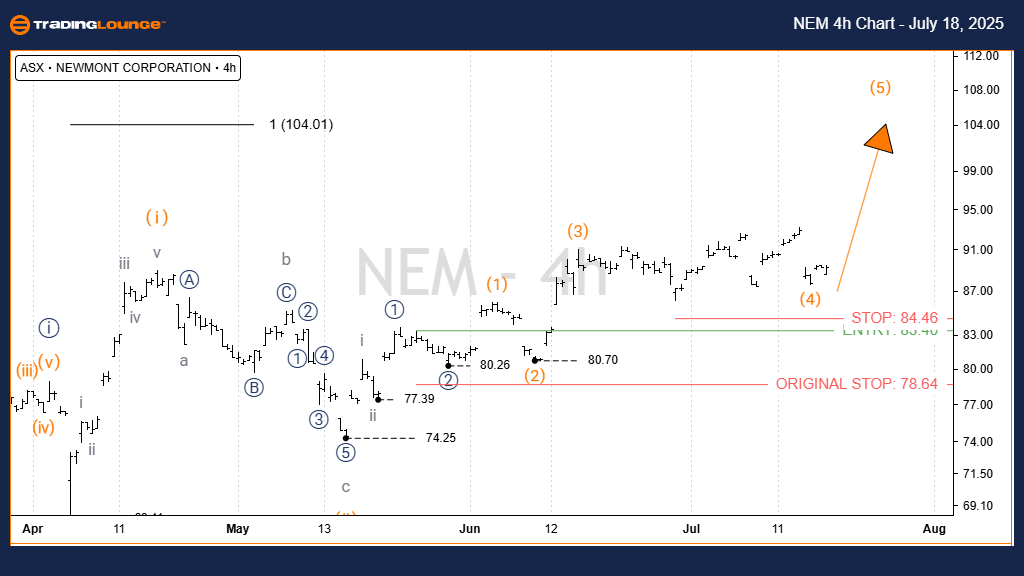
ASX: NEWMONT CORPORATION - NEM Elliott Wave Technical Analysis (4-Hour Chart)

Function: Primary trend (Minor degree, grey)

Mode: Motive

Structure: Impulse

Current Position: Wave iii) orange of Wave ((iii)) navy of Wave 3 grey

Technical Overview:

The 4-hour chart reinforces the daily analysis.

Wave iii) orange continues its upward move, with a near-term target of 100.00.

A smaller degree wave iii grey also projects toward 90.00.

Invalidation Level: Any drop below 74.25 would signal a potential change in the wave count.

Technical Analyst: Hua (Shane) Cuong, CEWA‑M (Certified Elliott Wave Analyst – Master Level)

Source: Visit Tradinglounge.com and learn from the Experts. Join TradingLounge Here 

See Previous: AMCOR PLC – AMC Elliott Wave Technical Analysis

VALUE Offer - $1 for 2 Weeks then $29 a month!Click here

Access 7 Analysts Over 200 Markets Covered. Chat Room With Support

NEM-Asx-4h-Chart-180...


Conclusion

The Elliott Wave count on ASX:NEM supports both long-term and short-term trend analysis. With price validation and invalidation zones clearly defined, traders can confidently interpret potential market moves. Monitoring levels near 90.00 and 100.00 remains critical for managing risk and capitalizing on upward momentum in NEWMONT CORPORATION's share price.

Related

Currency Pair Australian Dollar and Japanese Yen (AUDJPY) Elliott Wave Technical Analysis and Forex Signals

Currency Pair Australian Dollar and Japanese Yen (AUDJPY) Elliott Wave Technical Analysis and Forex Signals

Our comprehensive AUDJPY Elliott Wave analysis provides valuable insights into market trends, correc...

Read More >
Stay informed with the latest stock Analysis: CSL LIMITED - CSL Elliott Wave Technical Forecast

Stay informed with the latest stock Analysis: CSL LIMITED - CSL Elliott Wave Technical Forecast

Our detailed Elliott Wave analysis of CSL LIMITED (ASX: CSL) provides key insights into the stock...

Read More >
EICHER MOTORS - EICHERMOT Indian Stocks Elliott Wave Technical Analysis: Suggests Continued Upside Amid Critical Trend Structure Signals

EICHER MOTORS - EICHERMOT Indian Stocks Elliott Wave Technical Analysis: Suggests Continued Upside Amid Critical Trend Structure Signals

Bullish Elliott Wave analysis for Eicher Motors shows impulsive Orange Wave 3 within Navy Blue Wave...

Read More >
WTI Crude Oil Commodity Elliott Wave Technical Analysis:  Navigating the Complex Waves of the Oil Market

WTI Crude Oil Commodity Elliott Wave Technical Analysis: Navigating the Complex Waves of the Oil Market

The WTI crude oil prices using the Elliott Wave Theory focusing on the current triple zigzag correc...

Read More >
NEOUSD Elliott Wave Technical Analysis: Price Prediction, Trading Strategy, Support & Resistance Levels for NEO/USD Market Trends

NEOUSD Elliott Wave Technical Analysis: Price Prediction, Trading Strategy, Support & Resistance Levels for NEO/USD Market Trends

This analysis covers the NEOUSD Elliott Wave structure, highlighting the corrective phase and tradin...

Read More >
Detailed Bovespa Index Elliott Wave analysis, focusing on technical trends, impulse waves, and market predictions

Detailed Bovespa Index Elliott Wave analysis, focusing on technical trends, impulse waves, and market predictions

Bovespa Index Elliott Wave analysis, focuses on technical trends, impulse waves, and market predicti...

Read More >

$1 for 2 Weeks

then $29 a month!

What a Special Offer!

Trade Recommendations

Unleash the power of deversified trading with our comprehensive portfolio, covering 250+ markets:

  • Stock Trades
  • Crypto Trades
  • Forex Trades
  • Commodity Trades
Elliott Wave Analysis

Gain a competitive edge with expert insights and AI-powered Elliott Wave charting into:

  • Global Indices
  • US Stocks & ASX Stocks
  • Forex & Crypto
  • Commodities
Top-Notch Trading Tools

Equip yourself with the tools of success:

  • Real-time Chat rooms
  • Elliott Wave Algorithm
  • Portfolio tools
  • TradingLevels
  • Screener
  • Trading Game
7 Elliott Wave Analysts

Stay ahead of the market with daily charts and insightful videos
Your secret to strategic trading!

JOIN HERE


Welcome to TradingLounge (ASIC A.R.No. 321187), specialists in trades, trading education and technical analysis, covering stocks, indices, commodities, forex and cryptocurrencies.

When you join TradingLounge you have access to everything we offer, including trade tools, educational content and a social platform to chat with like-minded investors.

Read more

@Copyright 2024 by tradinglounge.com

Contact Us

Australian no: 02 4787 6020

International no: +61 (2) 47876020

Pay with:

Find us on