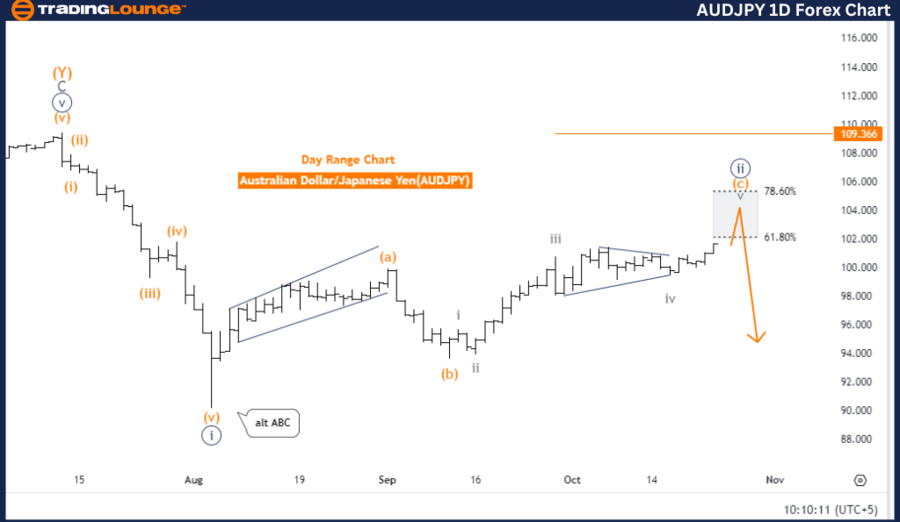
AUDJPY Elliott Wave Analysis Trading Lounge Day Chart
Australian Dollar / Japanese Yen (AUDJPY) Day Chart
AUDJPY Elliott Wave Technical Analysis
Function: Counter Trend
Mode: Impulsive
Structure: Orange wave C
Position: Navy blue wave 2
Next Lower Degree Direction: Navy blue wave 3
Details: The AUDJPY Elliott Wave analysis for the daily chart highlights a counter-trend movement categorized as impulsive. The current wave structure features orange wave C, which is part of a larger corrective phase known as navy blue wave 2. As orange wave C approaches its end, traders should anticipate the start of the next impulsive wave, navy blue wave 3.
With orange wave B now completed, orange wave C is unfolding within the structure of navy blue wave 2. This wave typically signals the last phase of the correction before the market transitions back to an impulsive trend, marked by navy blue wave 3. As the corrective wave nears completion, a potential reversal is on the horizon.
Once orange wave C finishes, the next move will likely be the beginning of navy blue wave 3, indicating the resumption of a broader impulsive trend, moving away from the current corrective structure. Traders should keep a close watch on the completion of orange wave C, as this could signal a bullish market shift.
The invalidation level for the current wave structure is set at 109.366. If the price falls below this level, the current Elliott Wave count will be invalidated, which could imply an extended corrective phase or require a reevaluation of the wave count.
Summary:
- Wave C of navy blue wave 2 is progressing
- The corrective phase is nearing its conclusion
- The next phase is expected to be navy blue wave 3
- Key invalidation level: 109.366
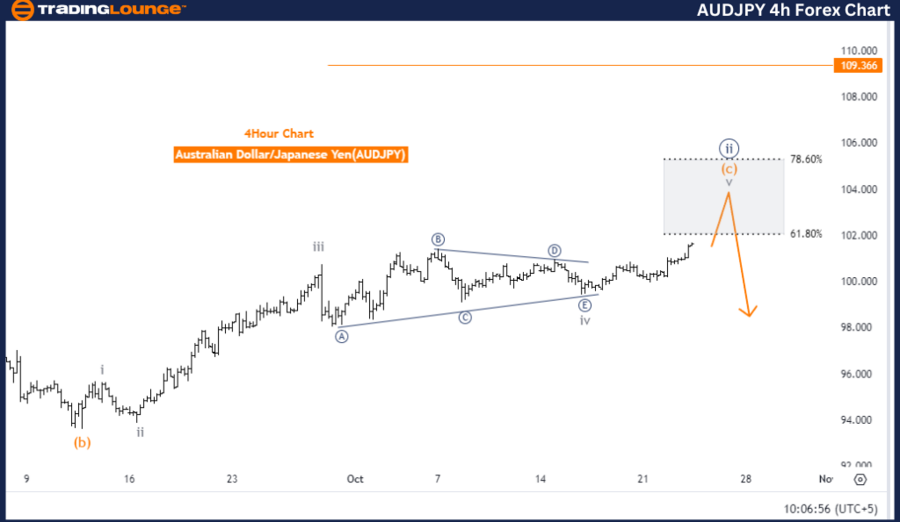
Australian Dollar / Japanese Yen (AUDJPY) 4-Hour Chart
AUDJPY Forex Pair Technical Analysis
Function: Counter Trend
Mode: Impulsive
Structure: Orange wave C
Position: Navy blue wave 2
Next Lower Degree Direction: Navy blue wave 3
Details: The AUDJPY Elliott Wave analysis on the 4-hour chart also points to a counter-trend movement in impulsive mode. At present, the market is progressing through orange wave C, which forms part of navy blue wave 2. This corrective phase is close to completion, setting the stage for a potential reversal into navy blue wave 3.
With orange wave B already finalized, the market is now in the final stages of orange wave C within navy blue wave 2. Typically, this wave marks the last corrective phase before the market resumes its impulsive trend. A move into navy blue wave 3 is expected, signifying a return to the dominant bullish trend, provided the price remains above the key invalidation level.
The invalidation level for this structure is 109.366. A drop below this point would invalidate the current Elliott Wave count and may suggest an extended correction or a need to reassess the current analysis.
Summary:
- Wave C of navy blue wave 2 is underway
- The corrective phase is nearing its end
- Navy blue wave 3 is the next anticipated move
- Key invalidation level: 109.366
Technical Analyst: Malik Awais
Source: visit Tradinglounge.com and learn From the Experts Join TradingLounge Here
Previous: AUDUSD Elliott Wave Technical Analysis
VALUE Offer - Buy 1 Month & Get 3 Months!Click here
Access 7 Analysts Over 200 Markets Covered. Chat Room With Support