GX Uranium ETF (URA) Commodity Elliott Wave Analysis
Function: Counter trend
Mode: Corrective
Structure: Impulse for wave (c)
Position: Wave (2)
Direction: Wave (3)
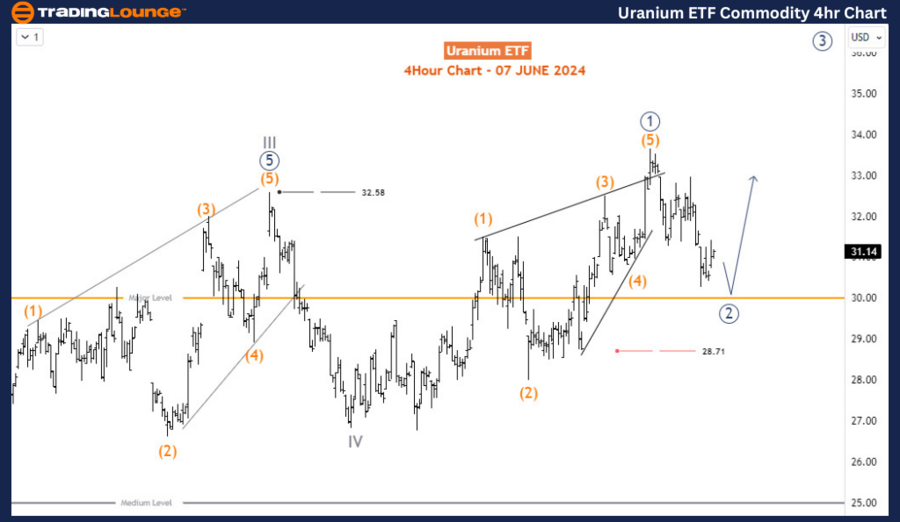
Details: The primary wave 2 (circled) is correcting to the 30 major levels where it could find support for the primary wave 3 to begin.
Overview of GX URA ETF: Uranium ETF Elliott Wave Technical Analysis
The GX URA ETF, also known as the Global X Uranium ETF, reflects the performance of firms in the uranium industry. It offers a diversified portfolio of global companies engaged in uranium mining, exploration, and production. As nuclear power gains traction as a cleaner energy source, with a potential uptick in uranium demand, the GX URA ETF provides investors with a unique opportunity to capitalize on the sector's growth.
Daily Chart Analysis:
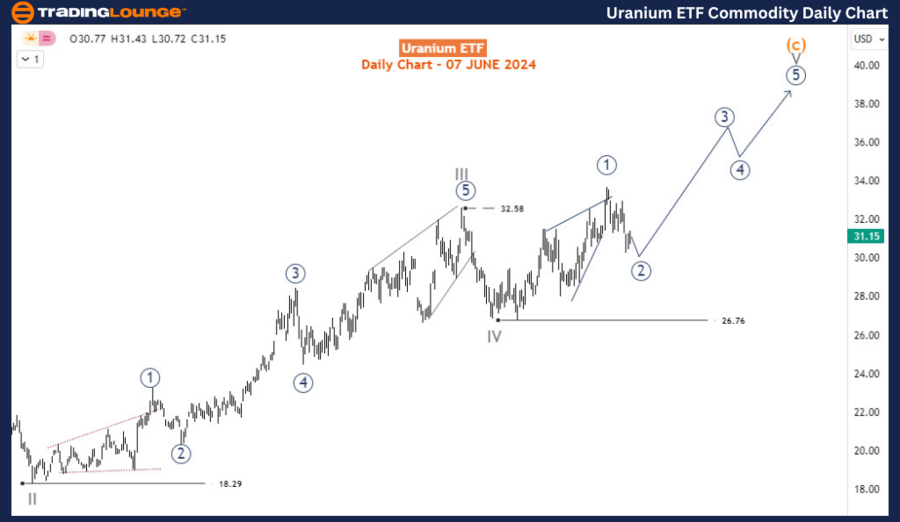
As depicted in the daily chart, URA completed wave II of the cycle degree in March 2023 at 18.29. From this low, the ETF ascended in an impulse wave, completing wave III at 32.58 and wave IV at 26.76. The current rally from March 2024 culminated in a diagonal pattern in May 2024, after which the price has been declining. Two primary scenarios are under consideration:
First Scenario:
- The diagonal pattern is considered the first sub-wave of wave V, i.e., primary degree wave 1 (circled).
- The current price decline is seen as a correction in primary degree wave 2 (circled).
- If primary wave 2 completes above 26.76 and the price breaks above the high of primary wave 1, then we can expect primary wave 3 (circled) of V to extend towards the 36-38 range.
Second Scenario:
- If the current decline from May 20, intended as wave 2 (circled) in the first scenario, breaks below 26.76, the diagonal pattern up to May 20 will be considered the end of wave V.
- This would imply the start of a three-wave bearish correction, targeting the 24-22 range.
Long-term Forecast:
The long-term forecast favours the first scenario, supporting a further rally in URA towards the 36-38 range in the coming weeks. However, the key invalidation level exists below 26.76, where the second scenario would come into play.

H4 Chart Analysis:
The H4 chart suggests that primary degree wave 2 (circled) is expected to find support around the 30 level. If this support holds, buyers are likely to resume, pushing the price higher in wave 3 (circled) above the most recent high of 33.72.
Summary:
The GX URA ETF, reflecting the uranium sector, has the potential for further growth based on Elliott Wave analysis. The preferred scenario indicates an impending rally towards 36-38, contingent on maintaining support above 26.76. The H4 chart aligns with this outlook, suggesting support at 30 and a subsequent rally above 33.72. Investors should monitor the 26.76 level for validation or invalidation of the primary scenario.
Technical Analyst: Sanmi Adeagbo
Source: visit Tradinglounge.com and learn From the Experts Join TradingLounge Here
See Previous: Silver XAGUSD Commodity Elliott Wave Technical Analysis
Special Trial Offer - 0.76 Cents a Day for 3 Months! Click here
Access 7 Analysts Over 170 Markets Covered. Chat Room With Support
