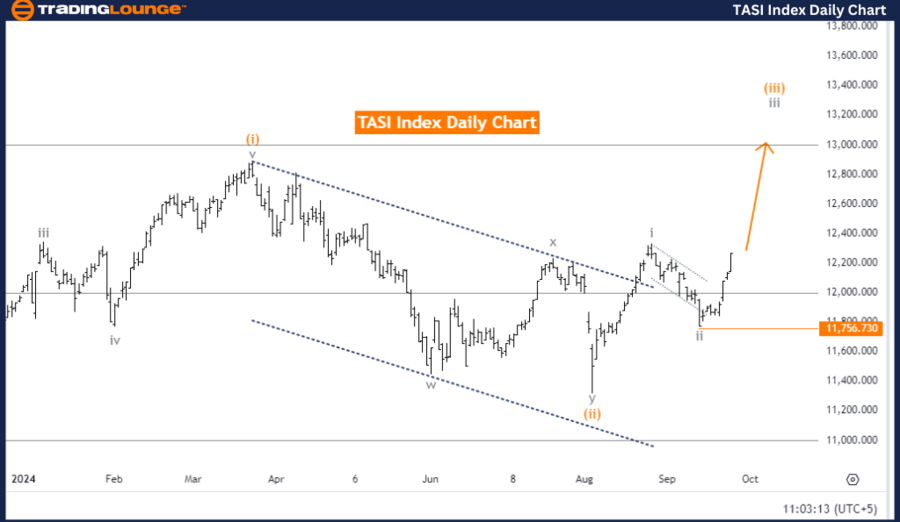
TASI Index Elliott Wave Analysis: TradingLounge Daily Chart
TASI Index Elliott Wave Technical Analysis
-
Function: Bullish Trend
-
Mode: Impulsive
-
Structure: Gray Wave 3
-
Position: Orange Wave 3
-
Next Lower Degrees Direction: Gray Wave 4
-
Details: Gray Wave 2 completed, now Gray Wave 3 is unfolding.
- Wave Cancel Invalid Level: 11756.730
The TASI Index continues to demonstrate a bullish trend, as shown by the Elliott Wave analysis on the daily chart. The market's impulsive mode signals strong upward momentum, with the ongoing wave structure identified as Gray Wave 3, which falls within the broader Orange Wave 3. This indicates that the market is aligning with a larger degree upward trend.
Gray Wave 2 has now completed, marking the end of a corrective phase. The market is advancing through Gray Wave 3, typically characterized by increased momentum and price appreciation, further affirming the bullish direction.
Additionally, the analysis highlights a wave cancel invalidation level at 11756.730, serving as a key threshold for validating the current wave count. If the price dips below this level, the current wave count will be invalidated, potentially leading to a reversal or significant correction.
Summary:
The TASI Index is currently experiencing a robust upward trend, propelled by the unfolding Gray Wave 3 within Orange Wave 3. The completion of Gray Wave 2 suggests that the market has moved out of a corrective phase into a strong upward trend. Traders should pay close attention to the invalidation level at 11756.730, as a breach below this level could disrupt the current bullish structure and indicate a shift in market conditions.
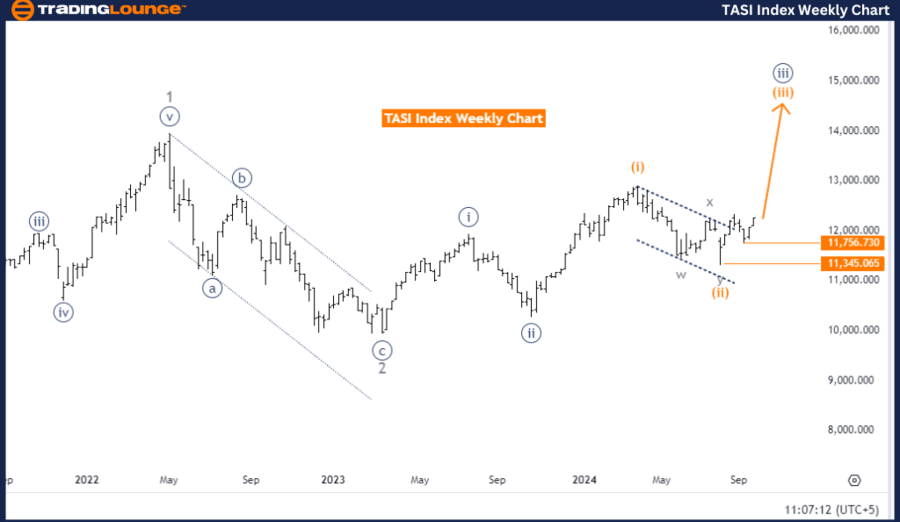
TASI Index Elliott Wave Analysis: Weekly Chart
TASI Index Elliott Wave Technical Analysis
-
Function: Bullish Trend
-
Mode: Impulsive
-
Structure: Orange Wave 3
-
Position: Navy Blue Wave 3
-
Next Lower Degrees Direction: Orange Wave 4
-
Details: Orange Wave 2 completed, now Orange Wave 3 is unfolding.
- Wave Cancel Invalid Level: 11756.730
On the weekly chart, the TASI Index remains in a bullish trend according to Elliott Wave analysis. The trend is classified as impulsive, denoting a strong and sustained upward movement. The current wave structure is labeled as Orange Wave 3, situated within the larger Navy Blue Wave 3, indicating that the index is advancing within a higher degree bullish phase.
The completion of Orange Wave 2 marks the end of a corrective phase, with Orange Wave 3 now progressing. This wave is typically associated with strong upward movement driven by increased buying pressure. As Orange Wave 3 unfolds, the bullish trend is likely to continue, with potential new highs before any significant correction.
A crucial invalidation level is identified at 11756.730. Should the price fall below this threshold, it would invalidate the current wave count, signaling a possible market trend shift. This level is critical for traders to monitor as it confirms the integrity of the Elliott Wave structure.
Summary:
The TASI Index is in a strong bullish phase, led by Orange Wave 3 within Navy Blue Wave 3. The completion of Orange Wave 2 indicates the index has resumed its upward momentum after a correction. Traders should carefully observe the invalidation level at 11756.730, as a price drop below this level could suggest a shift in the bullish outlook. However, as long as the price remains above this key threshold, the upward trend is expected to continue.
Technical Analyst: Malik Awais
Source: visit Tradinglounge.com and learn From the Experts Join TradingLounge Here
Previous: KOSPI Composite Elliott Wave Technical Analysis
VALUE Offer - Buy 1 Month & Get 3 Months!Click here
Access 7 Analysts Over 200 Markets Covered. Chat Room With Support