16Dec

JP Morgan & Chase Co. (JPM) Elliott Wave Technical Analysis: JP Morgan Stock Trends, Wave 5 Insights, Price Targets, and Bullish Forecasts

JP Morgan & Chase Co. (JPM) Elliott Wave Analysis - Trading Lounge Daily Chart

JPM Elliott Wave Technical Analysis

Function: Trend

Mode: Impulsive

Structure: Motive

Position: Minor wave 5

Direction: Upside in 5 of (5)

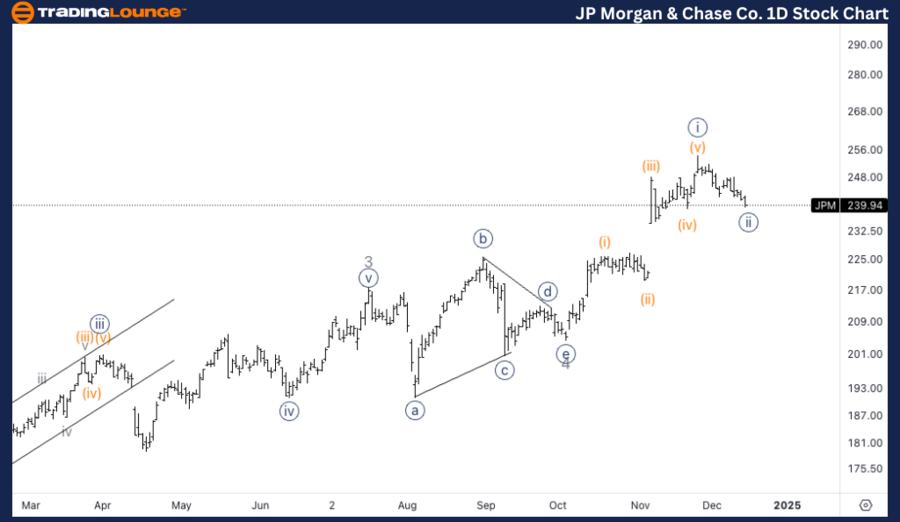
Details: The analysis indicates an upward continuation in Minor wave 5, aiming for the next significant TradingLevel at $300. If the stock sustains support above MG1 at $230, it is likely to maintain its bullish momentum.

JPM Elliott Wave Technical Analysis – Daily Chart

The daily chart highlights that Minor wave 5 is underway, with momentum targeting a move higher in wave 5 of (5). Sustaining support above $230 in MG1 could open the path for an advance toward the next TradingLevel at $300. The bullish structure remains intact, provided the stock holds support above $230.

JP-Morgan-&-Chase-Co...


JP Morgan & Chase Co. (JPM) Elliott Wave Analysis - Trading Lounge 1H Chart

JPM Elliott Wave Technical Analysis

Function: Trend

Mode: Impulsive

Structure: Motive

Position: Wave (c) of {ii}

Direction: Bottom in wave (c)

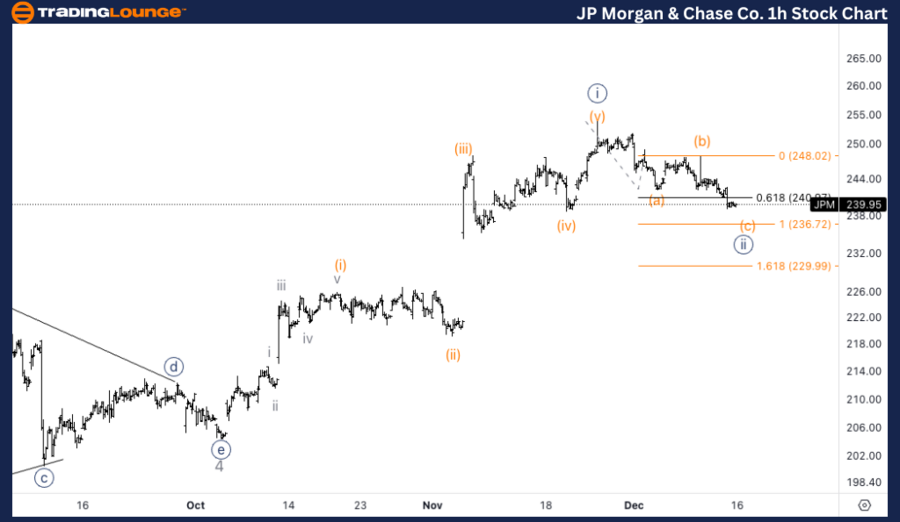
Details: The current move suggests nearing a bottom in wave (c) of {ii}, with equality of (c) vs. (a) anticipated around $236. A reversal at this level may trigger the next bullish wave.

JPM Elliott Wave Technical Analysis – 1H Chart

The 1-hour chart signals that JPM is approaching the conclusion of wave (c) of {ii}, with equality between (c) and (a) projected at $236. Once the correction concludes, a bullish reversal is expected, potentially initiating the next impulsive wave and resuming the upward trend.

Technical Analyst: Alessio Barretta

Source: visit Tradinglounge.com and learn From the Experts Join TradingLounge Here 

See Previous: Visa Inc. (V) Elliott Wave Technical Analysis

VALUE Offer - Buy 1 Month & Get 3 Months!Click here

Access 7 Analysts Over 200 Markets Covered. Chat Room With Support

JP-Morgan-&-Chase-Co...


Summary of JPM Elliott Wave Analysis

This Elliott Wave analysis of JP Morgan & Chase Co. (JPM) evaluates both the daily and 1-hour charts to gauge market direction. Using Elliott Wave Theory, the analysis anticipates a bullish continuation in Minor wave 5 on the daily chart and a reversal into the next impulsive wave on the 1-hour chart.

Related

In-Depth Cocoa Elliott Wave Analysis: Accurate Price Forecasts, Market Trends, and Commodity Trading Strategies

In-Depth Cocoa Elliott Wave Analysis: Accurate Price Forecasts, Market Trends, and Commodity Trading Strategies

Explore our detailed Cocoa Elliott Wave Analysis to stay ahead in the commodity market. Learn about ...

Read More >
Unlocking ASX Trading Success: TRANSURBAN GROUP – TCL Stock Analysis & Elliott Wave Technical Forecast

Unlocking ASX Trading Success: TRANSURBAN GROUP – TCL Stock Analysis & Elliott Wave Technical Forecast

The Transurban Group's stock performance (TCL) on the ASX through the lens of Elliott Wave theor...

Read More >
XOM Elliott Wave Analysis: Technical Insights on Exxon Mobil Corp. - 5 February 24

XOM Elliott Wave Analysis: Technical Insights on Exxon Mobil Corp. - 5 February 24

This Elliott Wave analysis of Exxon Mobil Corp. (XOM) on both daily and 4-hour charts provides valua...

Read More >
INFOSYS – INFY Stock Elliott Wave Technical Analysis: Is a Major Top Forming? Prepare for Potential Correction

INFOSYS – INFY Stock Elliott Wave Technical Analysis: Is a Major Top Forming? Prepare for Potential Correction

This detailed Elliott Wave analysis of Infosys stock explores the recent price trends and potential ...

Read More >
Actionable Insights on NASDAQ Composite Trading with a Focus on Elliott Wave Analysis and NDX forecasts

Actionable Insights on NASDAQ Composite Trading with a Focus on Elliott Wave Analysis and NDX forecasts

Discover actionable insights on NASDAQ Composite trading with a focus on Elliott Wave Analysis and N...

Read More >
The Elliott Wave Analysis for Texas Instruments Inc. (TXN) Reveals a Bullish Trend, Supported by Both the Daily and 1-hour Charts

The Elliott Wave Analysis for Texas Instruments Inc. (TXN) Reveals a Bullish Trend, Supported by Both the Daily and 1-hour Charts

Our Elliott Wave analysis for Texas Instruments Inc. (TXN) highlights a bullish trend, with both dai...

Read More >

Buy 1 Month

Get 3 Months!

Special Offer:

Trade Recommendations

Unleash the power of deversified trading with our comprehensive portfolio, covering:

  • Stock Trades
  • Crypto Trades
  • Forex Trades
  • Commodity Trades
Elliott Wave Analysis

Gain a competive edge with expert insights in to:

  • Global Indices
  • US Stocks & ASX Stocks
  • Forex & Crypto
  • Commodities
Top-Notch Trading Tools

Equip yourself with the tools of success:

  • Social Chat
  • Elliott Wave Algorithm
  • Screener
  • TradingLevels
  • Trading Game
7 Elliott Wave Analysts

Stay ahead of the market with daily charts and insightful videos
-Your secret to strategic trading!

JOIN HERE


Welcome to TradingLounge (ASIC A.R.No. 321187), specialists in trades, trading education and technical analysis, covering stocks, indices, commodities, forex and cryptocurrencies.

When you join TradingLounge you have access to everything we offer, including trade tools, educational content and a social platform to chat with like-minded investors.

Read more

@Copyright 2024 by tradinglounge.com

Contact Us

Australian no: 02 4787 6020

International no: +61 (2) 47876020

Pay with:

Find us on