Cocoa Commodity Elliott Wave Technical Analysis

Function: Counter-trend

Mode: Corrective

Structure: Double Zigzag

Position: Blue wave ‘b’

Direction: Blue wave ‘b’ remains active

Details: Cocoa encountered resistance at the critical 10,000 level, as anticipated. A minimum three-wave decline below 8000 is expected, with a potential impulse breakdown toward 5,000 for wave c (circled).

Cocoa Elliott Wave Technical Analysis

After a two-week recovery, Cocoa appears set for another downturn, placing sellers in control for the short term. Despite the long-term bullish trend, the current bearish retracement from the all-time high is expected to continue lower in the coming weeks.

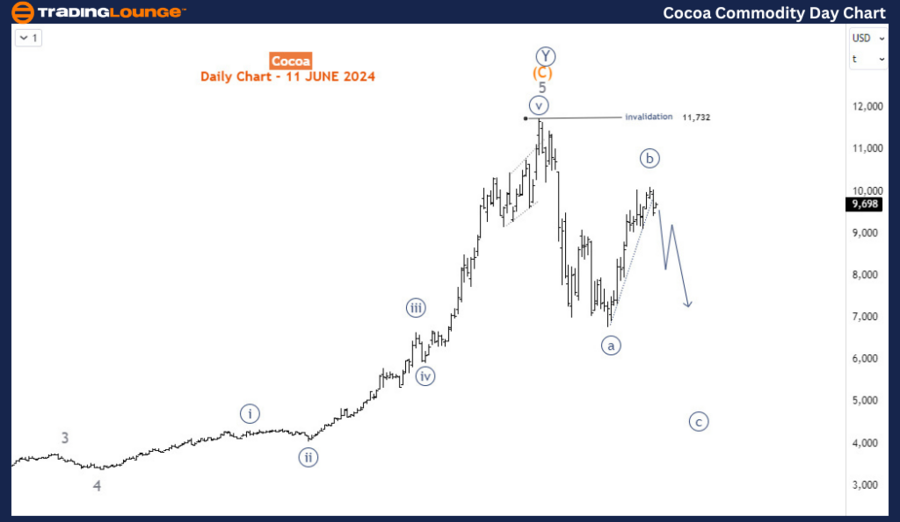
Cocoa Daily Chart Analysis:

In April 2024, Cocoa completed a long-term bullish impulse wave that began in October 2022, when prices were around 2198. Reaching a peak at 11732 in April 2024, Cocoa started a bearish retracement, forming a bearish impulse wave. From this peak, we anticipate at least a three-wave pullback or a larger bearish correction. Given the path of least resistance, a three-wave drop is projected, labeled as waves a-b-c (circled in navy blue). The first two legs, waves a and b, seem complete, with wave b encountering resistance at the 10,000 major level, as shown on the H4 chart. If wave c declines from the 10,000 level, it could target the 5,000 medium level.

Cocoa-Commodity-day-...


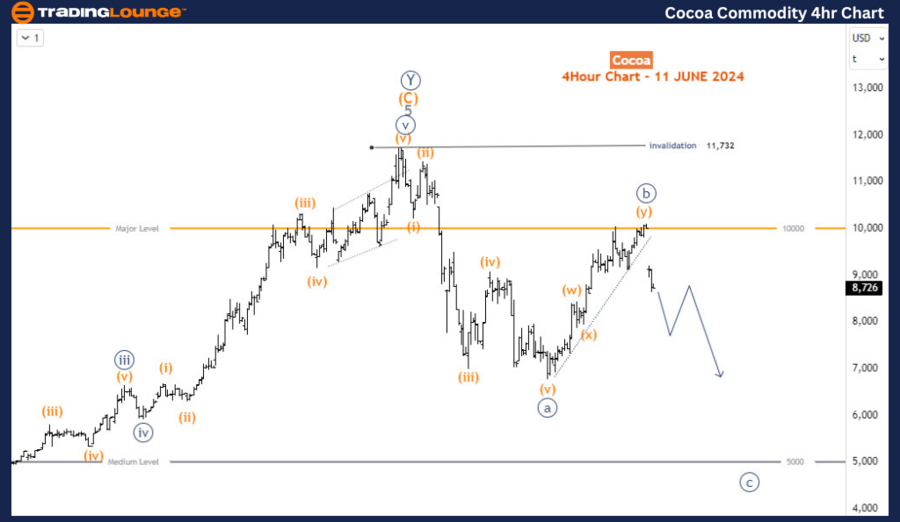
Cocoa Commodity H4 Chart Analysis:

The H4 chart indicates that the price broke below the trend line connecting the sub-waves of wave b (circled in navy blue), potentially marking the start of wave c of the same degree. Confirmation requires a more decisive move to the downside. The invalidation level for this bearish scenario is at 11732. A break above this level would indicate the continuation of the long-term bullish impulse trend. Current price action, however, suggests a downward movement toward the 5,000 level in the short and medium term.

Technical Analyst: Sanmi Adeagbo

Source: visit Tradinglounge.com and learn From the Experts Join TradingLounge Here 

See Previous: Gold XAUUSD Elliott Wave Technical Analysis

Special Trial Offer - 0.76 Cents a Day for 3 Months! Click here

Access 7 Analysts Over 170 Markets Covered. Chat Room With Support

Cocoa-Commodity-4Hr-...

Summary:

Cocoa's recent two-week recovery appears to be a temporary pause in the larger bearish retracement that began from the all-time high. The daily chart shows a completed long-term bullish impulse wave from October 2022 to April 2024, followed by a bearish correction. The anticipated three-wave pullback, labeled a-b-c, has waves a and b seemingly complete, with wave b facing resistance at 10,000. The H4 chart supports the beginning of wave c, with potential downside targets around 5,000. The key invalidation level is 11732; a break above this would negate the bearish outlook and resume the long-term bullish trend. Traders should monitor for further downside movement, focusing on the 5,000 target in the short to medium term.

Related

British Pound/ Australian Dollar(GBPAUD) Chart Elliott Wave Technical Analysis 18 October 23

British Pound/ Australian Dollar(GBPAUD) Chart Elliott Wave Technical Analysis 18 October 23

In summary, the GBPAUD Elliott Wave Analysis for 18 October 23, delivers essential insights for trad...

Read More >
Cardano/ U.S. dollar(ADAUSD) Elliott Wave Technical Analysis 7 November 23

Cardano/ U.S. dollar(ADAUSD) Elliott Wave Technical Analysis 7 November 23

ADAUSD Crypto Analysis - Cardano/ U.S. dollar(ADAUSD) Elliott Wave Technical Analysis on 7 November ...

Read More >
Tesla Inc.(TSLA:NASDAQ) Elliott Wave Technical Analysis 18 October 23

Tesla Inc.(TSLA:NASDAQ) Elliott Wave Technical Analysis 18 October 23

Tesla Inc.(TSLA:NASDAQ) Elliott Wave Technical Analysis  TSLA: 1-hour Chart and 4H Chart, 18 October...

Read More >
Explore Advanced Micro Devices Inc. (AMD) Stocks Elliott Wave Analysis and Potential Price movements, Optimize Trading Strategy

Explore Advanced Micro Devices Inc. (AMD) Stocks Elliott Wave Analysis and Potential Price movements, Optimize Trading Strategy

Unlock expert insights into AMD's stock trends with our comprehensive Elliott Wave analysis. Exp...

Read More >
S&P 500, NASDAQ 100, DAX 40, FTSE 100, ASX200: Elliott Wave Trading Strategies

S&P 500, NASDAQ 100, DAX 40, FTSE 100, ASX200: Elliott Wave Trading Strategies

Today's stock market analysis focuses on the Elliott Wave technical assessment of major indices ...

Read More >
Euro/U.S.Dollar(EURUSD) Forex Elliott Wave Technical Analysis: Comprehensive Look at Trading Patterns

Euro/U.S.Dollar(EURUSD) Forex Elliott Wave Technical Analysis: Comprehensive Look at Trading Patterns

Our detailed EURUSD Elliott Wave analysis helps traders anticipate EURUSD movements by outlining key...

Read More >

Buy 1 Month

Get 3 Months!

Special Offer:

Trade Recommendations

Unleash the power of deversified trading with our comprehensive portfolio, covering:

  • Stock Trades
  • Crypto Trades
  • Forex Trades
  • Commodity Trades
Elliott Wave Analysis

Gain a competive edge with expert insights in to:

  • Global Indices
  • US Stocks & ASX Stocks
  • Forex & Crypto
  • Commodities
Top-Notch Trading Tools

Equip yourself with the tools of success:

  • Social Chat
  • Elliott Wave Algorithm
  • Screener
  • TradingLevels
  • Trading Game
7 Elliott Wave Analysts

Stay ahead of the market with daily charts and insightful videos
-Your secret to strategic trading!

JOIN HERE


Welcome to TradingLounge (ASIC A.R.No. 321187), specialists in trades, trading education and technical analysis, covering stocks, indices, commodities, forex and cryptocurrencies.

When you join TradingLounge you have access to everything we offer, including trade tools, educational content and a social platform to chat with like-minded investors.

Read more

@Copyright 2024 by tradinglounge.com

Contact Us

Australian no: 02 4787 6020

International no: +61 (2) 47876020

Pay with:

Find us on