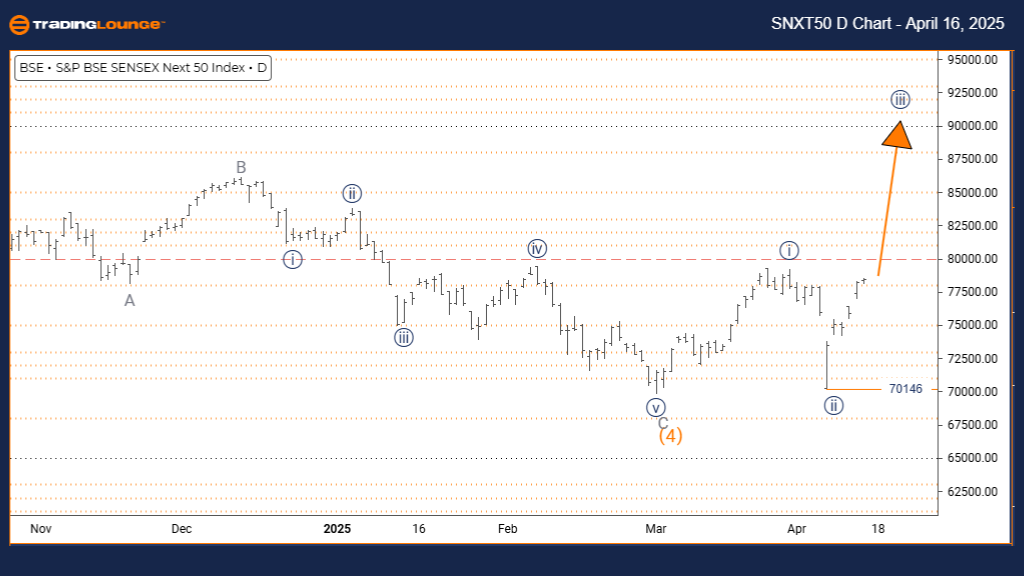
S&P BSE SENSEX NEXT 50 – Elliott Wave Analysis | TradingLounge Daily Chart
BSE SENSEX NEXT 50 Elliott Wave Technical Forecast
FUNCTION: Bullish Trend
MODE: Impulsive
STRUCTURE: Navy Blue Wave 3
POSITION: Gray Wave 1
DIRECTION NEXT LOWER DEGREES: Navy Blue Wave 4
DETAILS: Navy Blue Wave 2 appears complete; Wave 3 in progress
Wave Cancel Invalid Level: 70146
The S&P BSE SENSEX NEXT 50 index on the daily chart shows a developing bullish Elliott Wave pattern in an impulsive structure. The recent correction in Navy Blue Wave 2 looks complete, and the index is now advancing into Navy Blue Wave 3, part of the broader Gray Wave 1 formation. This wave count indicates strong bullish momentum and potential for sustained upside.
Typically, Wave 3 in an impulsive pattern is the most dynamic, characterized by increased volume and broader market participation. This sets the stage for a sharp rally, likely exceeding the price range of Wave 1, reinforcing the bullish sentiment across the index.
Following Wave 3, a correction in Navy Blue Wave 4 is expected. This pullback may present a fresh buying opportunity within the ongoing uptrend, offering traders an entry before the continuation of the bullish phase. The daily chart underlines a crucial point in the current uptrend, suggesting increased attention from technical traders.
Key Support Level:
A key technical level to monitor is 70146. A break below this point would invalidate the current Elliott Wave outlook, signaling the need for a revised analysis. This level represents the low of Wave 2 and provides a critical support zone for ongoing bullish momentum.
Trader’s Focus:
During Wave 3, traders should look for strong upward price action, sustained volume increase, and momentum confirmation. These indicators support bullish positioning while preparing for signs of Wave 3 exhaustion. Monitoring candlestick structure and divergence in momentum indicators will be essential to managing trades during this impulsive phase.
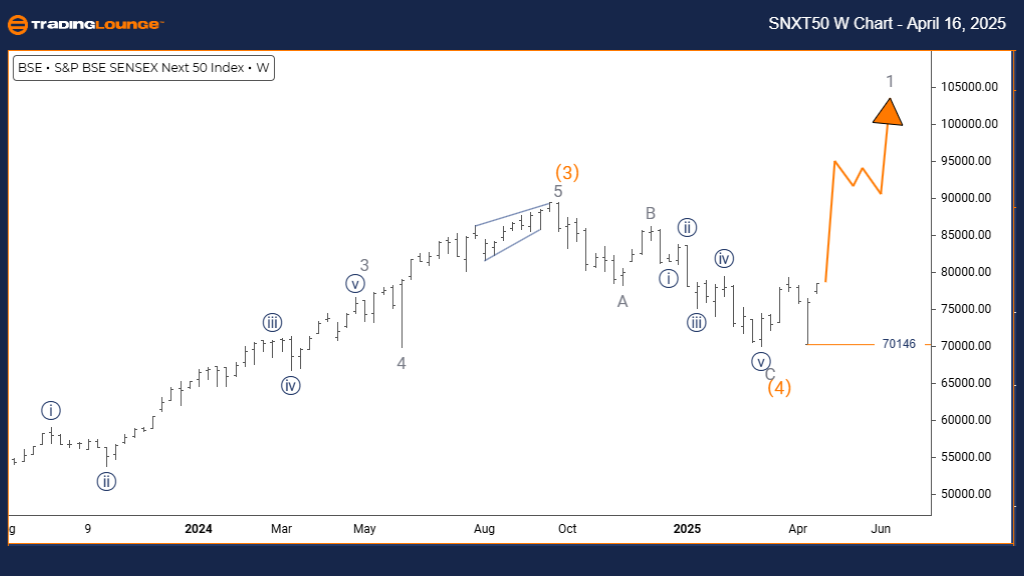
S&P BSE SENSEX NEXT 50 – Elliott Wave Analysis | TradingLounge Weekly Chart
BSE SENSEX NEXT 50 Weekly Elliott Wave Forecast
FUNCTION: Bullish Trend
MODE: Impulsive
STRUCTURE: Gray Wave 1
POSITION: Orange Wave 5
DIRECTION NEXT HIGHER DEGREES: Gray Wave 1 (Initiated)
DETAILS: Orange Wave 4 completed; Gray Wave 1 of 5 in motion
Wave Cancel Invalid Level: 70146
On the weekly chart, the S&P BSE SENSEX NEXT 50 continues its bullish impulsive wave structure, transitioning from the completion of Orange Wave 4 into Gray Wave 1, marking the start of the final Orange Wave 5. This move signals a potential climax in the current uptrend and could represent the last major rally before a larger correction sets in.
Gray Wave 1 often signals the early stages of a new bullish sequence, generally characterized by renewed optimism and fresh breakouts. As Orange Wave 4 concludes, the market appears poised for upward continuation, forming a compelling scenario for longer-term bullish strategies.
Outlook & Technical Levels:
The key technical level of 70146 remains essential for validating the bullish outlook. A drop below this threshold would challenge the current wave interpretation and demand a structural reassessment.
Trading Strategy & Risk Management:
In this early Gray Wave 1 stage, traders should focus on confirming breakout patterns, rising volume, and sustained price movement to validate continued upside. While the structure supports maintaining long positions, attention should also be given to signs of trend exhaustion, especially as Wave 5 progresses.
As Orange Wave 5 nears completion, signs of a major trend reversal may begin to emerge. Watch for divergences in RSI or MACD and classic topping patterns. This stage is critical for profit-taking and risk control, positioning traders for the next shift in market direction following this extended bullish cycle.
Technical Analyst: Malik Awais
Source: Visit Tradinglounge.com and learn from the Experts. Join TradingLounge Here
Previous: KOSPI Composite Elliott Wave Technical Analysis
VALUE Offer - Buy 1 Month & Get 3 Months!Click here
Access 7 Analysts Over 200 Markets Covered. Chat Room With Support