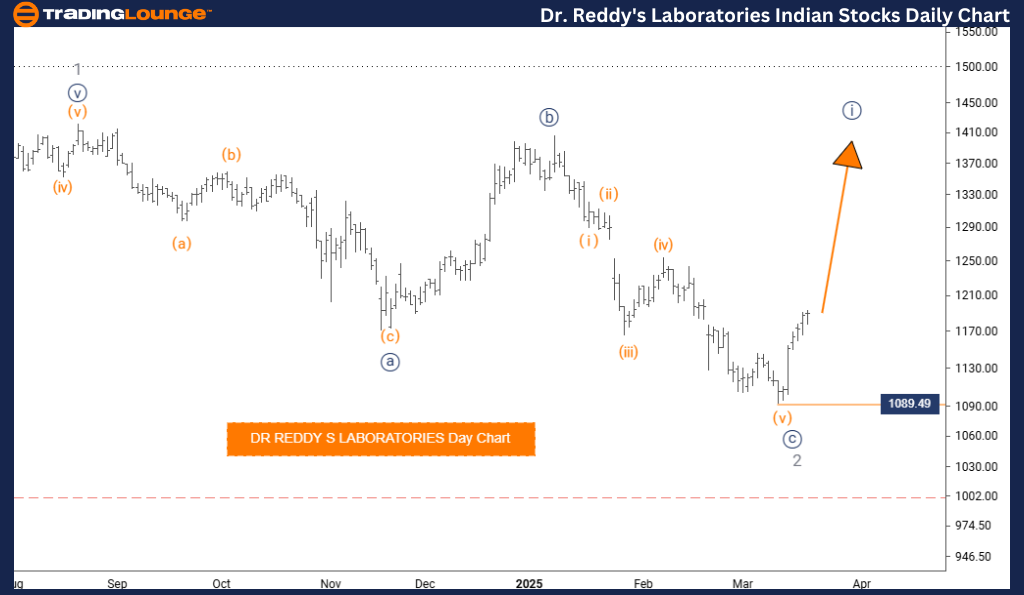
DR REDDY LABORATORIES Elliott Wave Analysis – TradingLounge Daily Chart
DR REDDY LABORATORIES Elliott Wave Technical Analysis
Function: Bullish Price Trend
Mode: Impulsive Movement
Structure: Navy Blue Wave 1
Position: Within Gray Wave 3
Next Higher Degree Direction: Navy Blue Wave 1 Initiated
Wave Invalidation Level: 1089.49
Analysis Summary:
The daily Elliott Wave analysis for DR REDDY LABORATORIES stock confirms a strong bullish price trend. The stock is exhibiting impulsive wave characteristics, suggesting a continued upward move. The focal wave, Navy Blue Wave 1, is unfolding inside the larger Gray Wave 3 formation, confirming bullish market conditions.
The analysis identifies the completion of Gray Wave 2, with Navy Blue Wave 1 of 3 now active and showing upward momentum. This wave phase is expected to expand further before encountering significant corrections.
Attention is drawn to Navy Blue Wave 1 on a higher degree, which has officially started. The critical invalidation level is 1089.49. If the stock price falls below this threshold, it will invalidate the current Elliott Wave structure and indicate a change in the prevailing trend.
Trading Outlook:
Traders should focus on Navy Blue Wave 1 progression and prepare for potential bullish extensions. Understanding wave patterns within the daily timeframe helps identify optimal entry and exit levels.
This daily chart-based Elliott Wave perspective allows traders to synchronize strategies with near-term momentum and upcoming reversals. Staying alert to wave transitions supports proactive and informed decision-making.
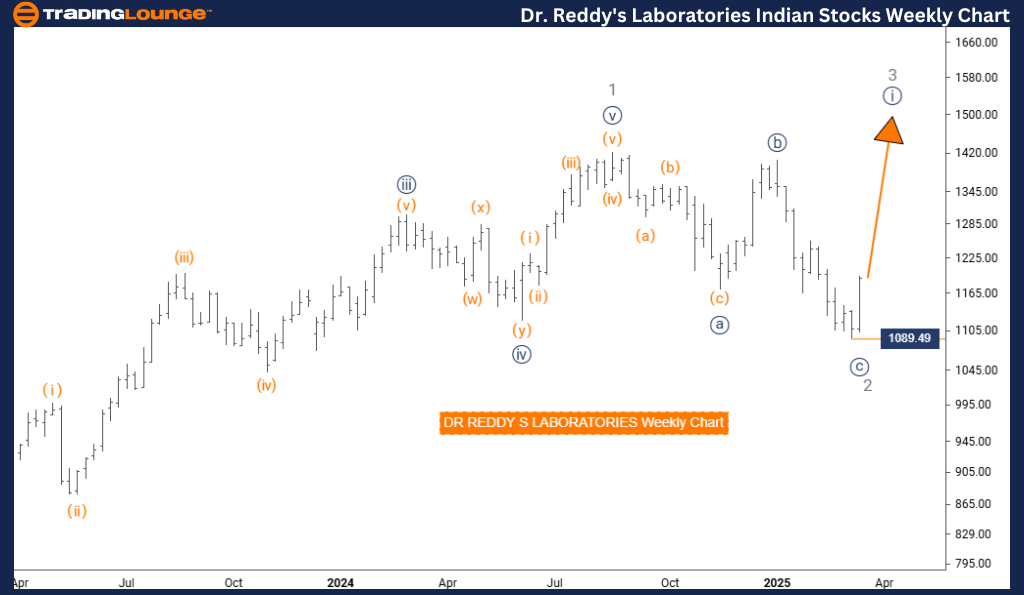
DR REDDY LABORATORIES Elliott Wave Analysis – TradingLounge Weekly Chart
DR REDDY LABORATORIES Elliott Wave Technical Analysis
Function: Long-Term Bullish Trend
Mode: Impulsive Wave Formation
Structure: Navy Blue Wave 1
Position: Inside Gray Wave 3
Next Higher Degree Direction: Initiated Navy Blue Wave 1
Wave Invalidation Level: 1089.49
Analysis Summary:
The weekly Elliott Wave outlook for DR REDDY LABORATORIES shares offers insights into the medium- and long-term bullish setup. The price action continues within an impulsive phase, supported by the emergence of Navy Blue Wave 1, part of the broader Gray Wave 3 trend.
Gray Wave 2 appears to have finalized, with Navy Blue Wave 1 of 3 gaining strength. This ongoing impulsive phase suggests robust buying interest and further potential for gains.
The analysis emphasizes the wave invalidation level at 1089.49. A break below this point would invalidate the existing wave scenario and require a revised technical view.
Trading Outlook:
Investors and swing traders should track Navy Blue Wave 1 development and anticipate further bullish price movement. Recognizing wave cycles enhances forecasting accuracy and helps tailor trade entries and exits.
By assessing the weekly timeframe, the analysis delivers a comprehensive view of the stock’s Elliott Wave structure. This enables strategic alignment with broader market patterns, supporting better long-term trade setups and risk control. Monitoring invalidation levels remains essential for adapting to evolving market conditions.
Technical Analyst: Malik Awais
Source: visit Tradinglounge.com and learn From the Experts Join TradingLounge Here
Previous:Bharat Electronics Elliott Wave Technical Analysis
VALUE Offer - Buy 1 Month & Get 3 Months!Click here
Access 7 Analysts Over 200 Markets Covered. Chat Room With Support