04Mar

Hang Seng Index Elliott Wave Technical Analysis: Market Trends, Wave Count, Price Prediction, and Trading Strategy for Investors

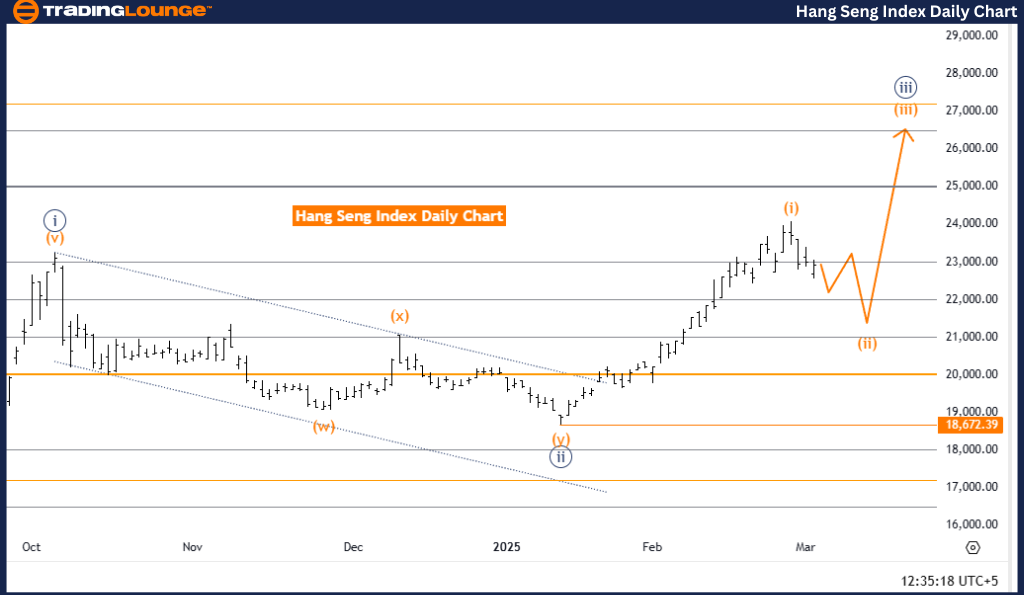
Hang Seng Index Elliott Wave Analysis – Trading Lounge Day Chart

Hang Seng Index Elliott Wave Technical Analysis

Function: Counter Trend

Mode: Corrective

Structure: Orange Wave 2

Position: Navy Blue Wave 3

Direction Next Higher Degree: Orange Wave 3

Details: Orange Wave 1 appears completed, and Orange Wave 2 is currently in play.

Invalidation Level: 18,672.39

Analysis Overview

The Hang Seng Index daily chart analysis indicates an ongoing corrective wave structure in a counter-trend movement. Currently, Orange Wave 2 is unfolding after the completion of Orange Wave 1, signaling a retracement phase before the potential continuation of the broader market trend.

The positioning within Navy Blue Wave 3 further emphasizes the corrective nature of the market. The next anticipated higher-degree wave, Orange Wave 3, is expected to begin after the current retracement concludes. This wave structure suggests that the market is experiencing a temporary pullback before a possible trend reversal.

The invalidation level is set at 18,672.39, serving as a crucial benchmark. If the price moves beyond this level, the current wave count will be invalidated, requiring a reevaluation of the Elliott Wave structure.

Conclusion

The Hang Seng Index remains in a corrective phase, with Orange Wave 2 developing after Orange Wave 1. The market is currently experiencing a retracement period before transitioning into Orange Wave 3. Traders should monitor critical price levels to determine potential trend continuation or reversal.

Hang-Seng-index-dail...


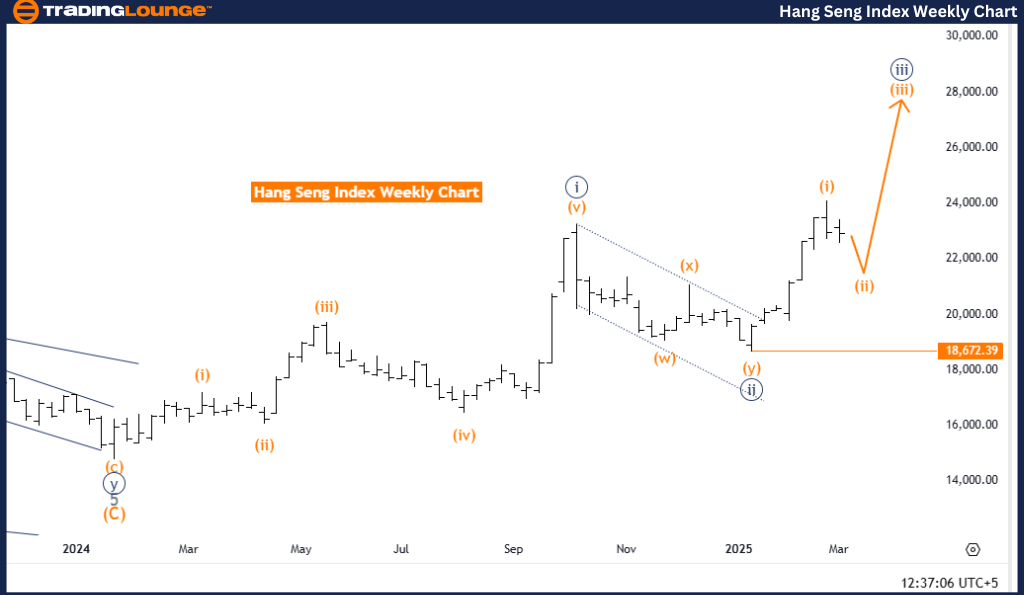
Hang Seng Index Elliott Wave Analysis – Trading Lounge Weekly Chart

Hang Seng Index Elliott Wave Technical Analysis

Function: Counter Trend

Mode: Corrective

Structure: Orange Wave 2

Position: Navy Blue Wave 3

Direction Next Higher Degree: Orange Wave 3

Details: Orange Wave 1 appears completed, and Orange Wave 2 is currently in play.

Invalidation Level: 18,672.39

Analysis Overview

The Hang Seng Index weekly chart analysis highlights a corrective wave pattern, indicating a counter-trend movement. The market is progressing through Orange Wave 2, following the completion of Orange Wave 1. This retracement suggests that the index is temporarily consolidating before potentially resuming its broader trend.

The position within Navy Blue Wave 3 confirms the corrective structure. The next anticipated higher-degree wave, Orange Wave 3, is likely to emerge once the current retracement in Orange Wave 2 is completed. This implies that the market is in a temporary pullback before a potential shift in momentum.

The invalidation level of 18,672.39 is a key reference point. A price movement beyond this level would require a reevaluation of the Elliott Wave structure to reassess market conditions.

Conclusion

The Hang Seng Index continues its corrective phase, with Orange Wave 2 unfolding after Orange Wave 1. The market remains in a retracement stage, setting up for the transition into Orange Wave 3. Traders should keep a close watch on critical price levels to gauge potential trend continuation or reversal.

Technical Analyst: Malik Awais

Source: visit Tradinglounge.com and learn From the Experts Join TradingLounge Here 

Previous: NASDAQ Elliott Wave Technical Analysis

VALUE Offer - Buy 1 Month & Get 3 Months!Click here

Access 7 Analysts Over 200 Markets Covered. Chat Room With Support

Hang-Seng-index-week...

Related

BNBUSD Price Prediction Using Elliott Wave Analysis: Binance Coin's Market Movements and Capitalize on Bullish Trends

BNBUSD Price Prediction Using Elliott Wave Analysis: Binance Coin's Market Movements and Capitalize on Bullish Trends

Discover the most up-to-date BNBUSD price prediction using Elliott Wave analysis. This detailed anal...

Read More >
Advanced Micro Devices Inc. (AMD) Elliott Wave Analysis: Daily & 1-Hour Chart Insights, Fibonacci Levels, and Stock Forecast

Advanced Micro Devices Inc. (AMD) Elliott Wave Analysis: Daily & 1-Hour Chart Insights, Fibonacci Levels, and Stock Forecast

AMD's Elliott Wave patterns, covering daily and 1-hour chart movements. Key insights include the...

Read More >
BRAMBLES LIMITED - BXB Stock Analysis: Elliott Wave Forecast, Key Price Levels, and ASX Trading Insights for Success

BRAMBLES LIMITED - BXB Stock Analysis: Elliott Wave Forecast, Key Price Levels, and ASX Trading Insights for Success

BRAMBLES LIMITED (ASX:BXB) highlights the potential upward momentum of the ((3))-navy wave. Key insi...

Read More >
SPDR Select Sector Fund ETF (XLF) Elliott Wave Technical Analysis: Expect a Bullish Continuation After a Potential Pullback

SPDR Select Sector Fund ETF (XLF) Elliott Wave Technical Analysis: Expect a Bullish Continuation After a Potential Pullback

This Elliott Wave analysis of SPDR Select Sector Fund ETF (XLF) provides an in-depth technical forec...

Read More >
Johnson & Johnson (JNJ) Stock Analysis: Elliott Wave Forecast, Bullish Trend Insights, Daily & 1-Hour Chart Breakdown

Johnson & Johnson (JNJ) Stock Analysis: Elliott Wave Forecast, Bullish Trend Insights, Daily & 1-Hour Chart Breakdown

Elliott Wave forecast for Johnson & Johnson (JNJ) stock, covering both daily and 1-hour charts. It a...

Read More >
Australian Dollar/U.S. Dollar (AUDUSD) Elliott Wave Analysis: Ideal for both Novice and Experienced Forex Traders

Australian Dollar/U.S. Dollar (AUDUSD) Elliott Wave Analysis: Ideal for both Novice and Experienced Forex Traders

Gain expert insights into the AUDUSD currency pair with a comprehensive Elliott Wave analysis. This ...

Read More >

$1 for 2 Weeks

then $29 a month!

What a Special Offer!

Trade Recommendations

Unleash the power of deversified trading with our comprehensive portfolio, covering 250+ markets:

  • Stock Trades
  • Crypto Trades
  • Forex Trades
  • Commodity Trades
Elliott Wave Analysis

Gain a competitive edge with expert insights and AI-powered Elliott Wave charting into:

  • Global Indices
  • US Stocks & ASX Stocks
  • Forex & Crypto
  • Commodities
Top-Notch Trading Tools

Equip yourself with the tools of success:

  • Real-time Chat rooms
  • Elliott Wave Algorithm
  • Portfolio tools
  • TradingLevels
  • Screener
  • Trading Game
7 Elliott Wave Analysts

Stay ahead of the market with daily charts and insightful videos
Your secret to strategic trading!

JOIN HERE


Welcome to TradingLounge (ASIC A.R.No. 321187), specialists in trades, trading education and technical analysis, covering stocks, indices, commodities, forex and cryptocurrencies.

When you join TradingLounge you have access to everything we offer, including trade tools, educational content and a social platform to chat with like-minded investors.

Read more

@Copyright 2024 by tradinglounge.com

Contact Us

Australian no: 02 4787 6020

International no: +61 (2) 47876020

Pay with:

Find us on