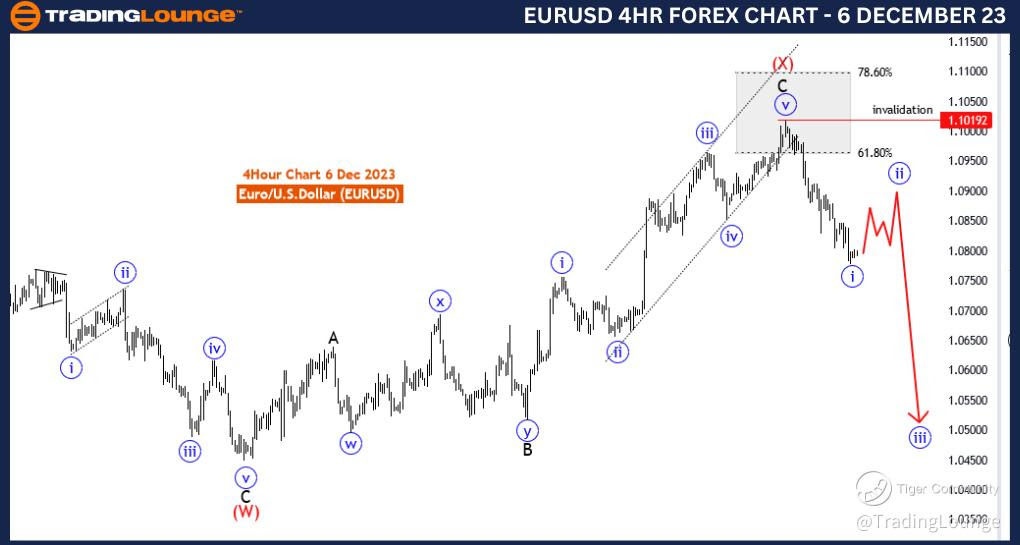
EURUSD Elliott Wave Analysis Trading Lounge 4 Hour Chart, 6 December 23
Euro/U.S.Dollar(EURUSD) 4 Hour Chart
EURUSD Elliott Wave Technical Analysis
Function: Counter Trend
Mode: impulsive as A
Structure:blue wave 2 of A
Position: Y of wave 2/B
Direction Next lower Degrees: blue wave 3 of A
Details:After blue wave 1 now blue wave 2 as a correction started . Wave Cancel invalid level: 1.10192
The "EURUSD Elliott Wave Analysis Trading Lounge 4 Hour Chart" for 6 December 623, offers a detailed examination of the Euro/U.S. Dollar (EURUSD) currency pair within a four-hour timeframe. Employing Elliott Wave principles, the analysis aims to provide traders with valuable insights into the current market conditions.
The identified "Function" is "Counter Trend," suggesting that the analysis is focused on a potential reversal or corrective movement within the broader market trend. Counter-trend analysis is crucial for traders looking to identify points of potential trend reversal.
The specified "Mode" is described as "impulsive as A," indicating that the current market movement is considered impulsive within the context of an Elliott Wave A-wave. Impulsive waves are characterized by strong and directional price movements, often representing the initial stage of a new trend.
The primary "Structure" is labeled as "blue wave 2 of A," denoting the specific degree of the impulsive wave within the Elliott Wave framework. This information helps traders understand the current phase of the market cycle and anticipate future price movements.
The designated "Position" is identified as "Y of wave 2/B," providing insights into the wave count within the larger degree of correction. This level of detail is crucial for traders employing Elliott Wave analysis to make informed decisions.
The directional guidance for "Next Lower Degrees" is "blue wave 3 of A," indicating the anticipation of the next impulsive wave within the larger correction. This information is vital for traders looking to align their strategies with the expected market direction.
Regarding "Details," the analysis notes that "After blue wave 1, now blue wave 2 as a correction started." This information informs traders that the market is currently in a correction phase following the completion of the first impulsive wave.
The "Wave Cancel invalid level" is specified as "1.10192," providing traders with a key level that, if reached, would invalidate the current wave count and suggest a reassessment of the market conditions.
In summary, the EURUSD Elliott Wave Analysis for the 4-hour chart on 6 December 23, highlights a counter-trend impulsive movement labeled as "wave 2 of A." The analysis provides details about the structure, position, and anticipated next wave, along with a critical level for potential wave cancellation.
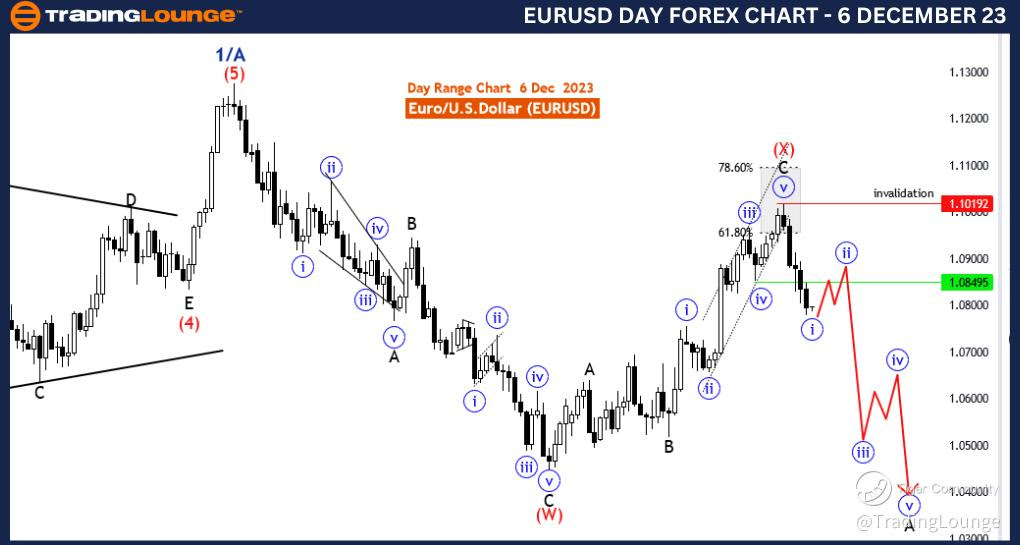
EURUSD Elliott Wave Analysis Trading Lounge Day Chart, 6 December 23
Euro/U.S.Dollar(EURUSD) Day Chart
EURUSD Elliott Wave Technical Analysis
Function: Counter Trend
Mode: impulsive as A
Structure:blue wave 2 of A
Position: Y of wave 2/B
Direction Next lower Degrees: blue wave 3 of A
Details:After blue wave 1 now blue wave 2 as a correction started . Wave Cancel invalid level: 1.10192
The "EURUSD Elliott Wave Analysis Trading Lounge Day Chart" for 6 December 23, delves into the Euro/U.S. Dollar (EURUSD) pair within a daily timeframe, employing Elliott Wave analysis to provide traders with a comprehensive view of market dynamics.
Identified as a "Counter Trend" analysis, the focus is on potential reversals against the prevailing market trend. This is crucial for traders aiming to capitalize on corrective movements or trend changes.
The analysis characterizes the current market "Mode" as "impulsive as A," signifying that the observed price action is impulsive and falls within the context of an A-wave in the Elliott Wave structure. Impulsive movements are typically strong and directional, often marking the initiation of a new trend.
The primary "Structure" is labeled as "blue wave 2 of A," detailing the current phase within the Elliott Wave framework. Understanding the wave structure is fundamental for traders to gauge the market's position in the broader cycle.
The specified "Position" is denoted as "Y of wave 2/B," indicating the current wave count within the larger degree of correction. This level of detail assists traders in comprehending the intricacies of the ongoing correction.
The directional guidance for "Next Lower Degrees" is projected as "blue wave 3 of A," suggesting an anticipation of the next impulsive wave within the overarching correction. This information is valuable for traders seeking alignment with the expected market direction.
In terms of "Details," the analysis notes that "After blue wave 1, now blue wave 2 as a correction started." This informs traders that the market is currently undergoing a corrective phase following the completion of the first impulsive wave.
The "Wave Cancel invalid level" is identified as "1.10192," serving as a critical threshold. If the market reaches this level, it would invalidate the current wave count, prompting a reconsideration of the prevailing market conditions.
To summarize, the EURUSD Elliott Wave Analysis for the day chart on 6 December 23, presents a counter-trend impulsive movement labeled as "wave 2 of A." The analysis provides insights into the wave structure, position, expected next wave, and a crucial level for potential wave cancellation.