ASX: NEWMONT CORPORATION NEM Elliott Wave Forecast & Technical Analysis | TradingLounge
Greetings,
This Elliott Wave technical analysis covers Newmont Corporation (ASX:NEM) on the Australian Stock Exchange. We observe bullish momentum building as part of Wave 3, with key Elliott Wave targets and invalidation points helping traders gauge trend sustainability.
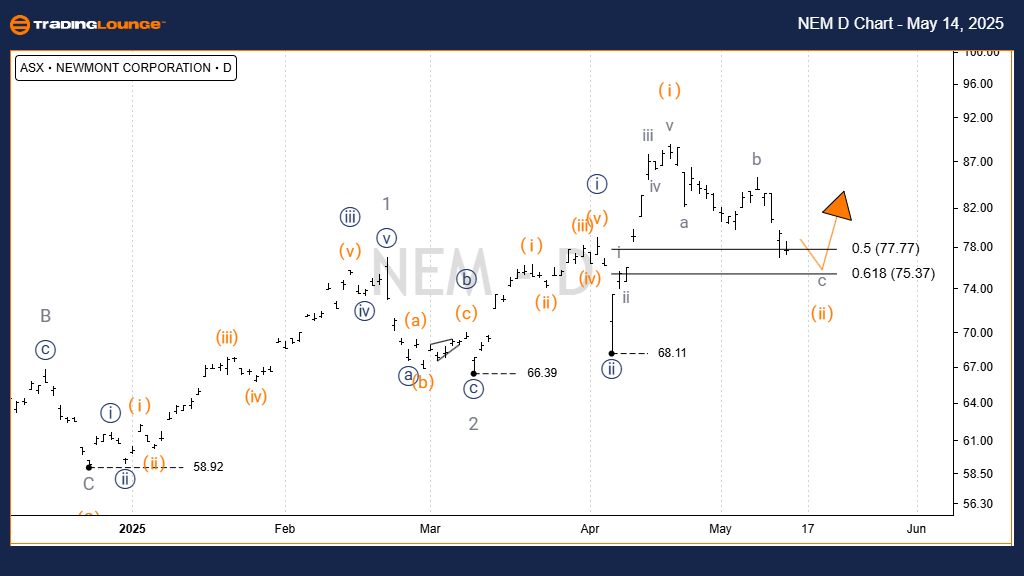
ASX: NEWMONT CORPORATION – NEM Elliott Wave Forecast 1-Day Chart (Semilog Scale)
Function: Long-term trend tracking (Minor degree, grey)
Mode: Motive wave development
Structure: Classic impulse
Wave Position: Wave c - grey of Wave ii) - orange of Wave iii) - navy of Wave 3 - grey
Key Insights:
- Wave ii) - orange has extended into a refined zigzag pattern labeled a, b, c - grey.
- We project the retracement to reach around 75.37, likely completing Wave ii) - orange.
- A decisive move above 85.21 would confirm the continuation of Wave iii) - orange to the upside.
Critical Invalidation Point: 68.11 – A move below this would challenge the current bullish outlook.
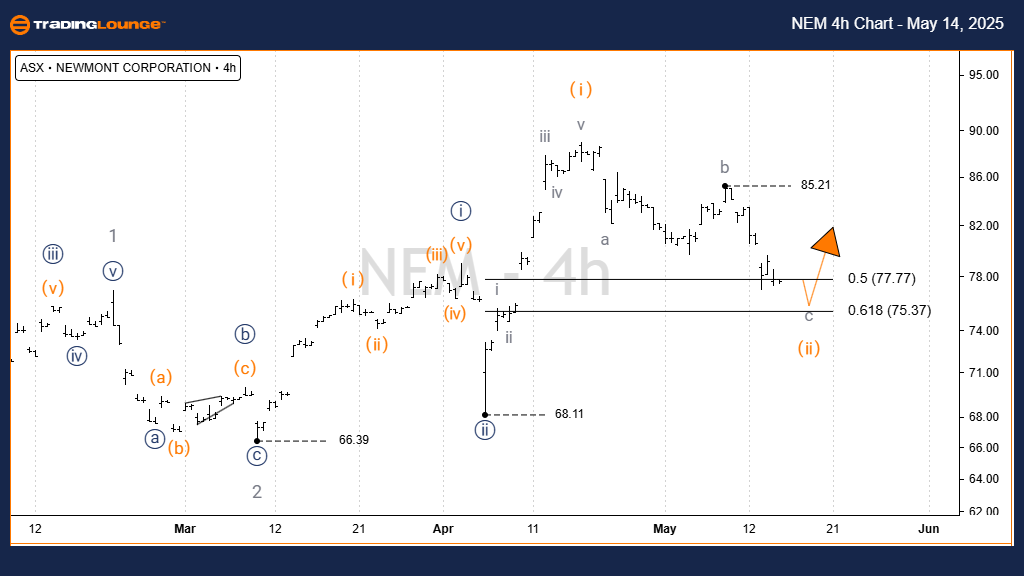
ASX: NEWMONT CORPORATION – NEM 4-Hour Elliott Wave Analysis
Function: Ongoing trend analysis (Minor degree, grey)
Mode: Impulse progression
Structure: Motive wave pattern
Wave Position: Wave ii) - orange of Wave ((iii)) - navy of Wave 3 - grey
Detailed Review:
- The 4-hour timeframe aligns with the daily structure, reflecting a consistent wave count.
- For confirmation of continued bullish structure, look for a breakout above 85.21.
- The 68.11 level remains the key invalidation zone, maintaining technical clarity.
- Key Levels:
Confirmation Point: 85.21
Invalidation Point: 68.11
Technical Analyst: Hua (Shane) Cuong, CEWA-M (Master’s Designation).
Source: Visit Tradinglounge.com and learn from the Experts. Join TradingLounge Here
See Previous: COCHLEAR LIMITED – COH Elliott Wave Technical Analysis
VALUE Offer - Buy 1 Month & Get 3 Months!Click here
Access 7 Analysts Over 200 Markets Covered. Chat Room With Support
Conclusion:
This Elliott Wave outlook for Newmont Corporation (ASX:NEM) offers a precise technical framework for traders. Defined support and resistance levels via wave counts enable disciplined decision-making. The strategy focuses on recognizing high-confidence trade setups aligned with long-term and short-term wave structures.