13May

Cochlear Limited Stock Forecast: Elliott Wave Technical Analysis of ASX:COH Reveals Bullish Impulse Setup and Price Targets Ahead

COCHLEAR LIMITED (COH) Elliott Wave Technical Analysis | TradingLounge

Overview:
This Elliott Wave technical outlook for COCHLEAR LIMITED (ASX:COH) provides an updated analysis of the stock's structure on the Australian Stock Exchange. Our current wave count identifies the conclusion of a corrective ABC wave, signaling the potential start of a bullish impulse wave. This forecast outlines prospective price targets, expected market direction, and essential invalidation levels to sustain the bullish scenario in COH shares.

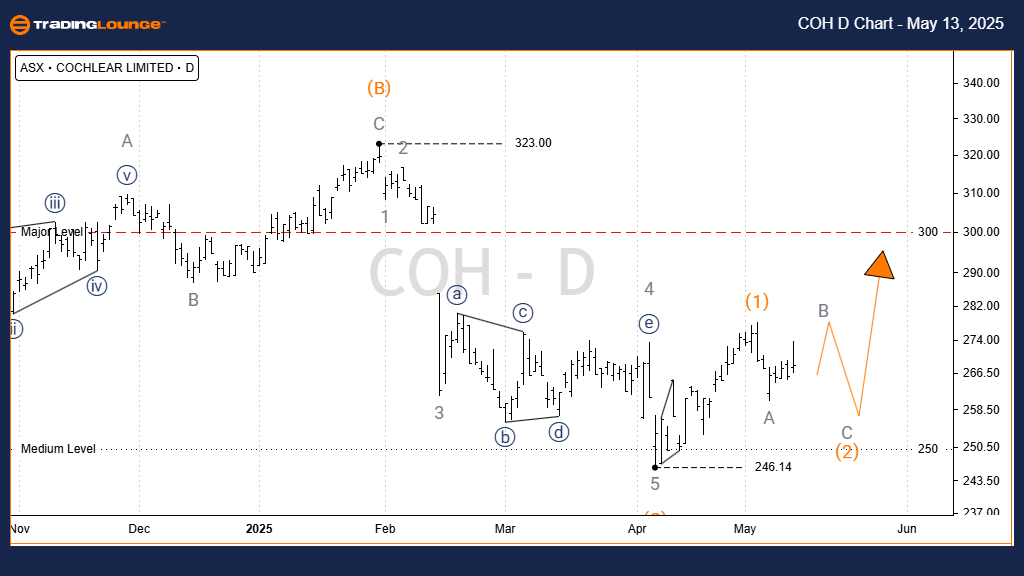
COCHLEAR LIMITED – COH | 1d Chart (Semilog Scale) Analysis

Function: Major Trend (Intermediate degree, Orange)

Mode: Motive

Structure: Impulse

Position: Wave 5)) - navy

Technical Insight:

The chart analysis indicates that Wave 4)) - navy has likely completed its corrective formation, marked A, B, and C) - orange. The breakout suggests the beginning of an upward trend forming Wave 5)) - navy. Based on this structure, Cochlear stock may revisit the previous peak at Wave 3)) - navy, targeting the $350.00 area.

Invalidation Point: 246.14

COH-Day-Crypto-chart...


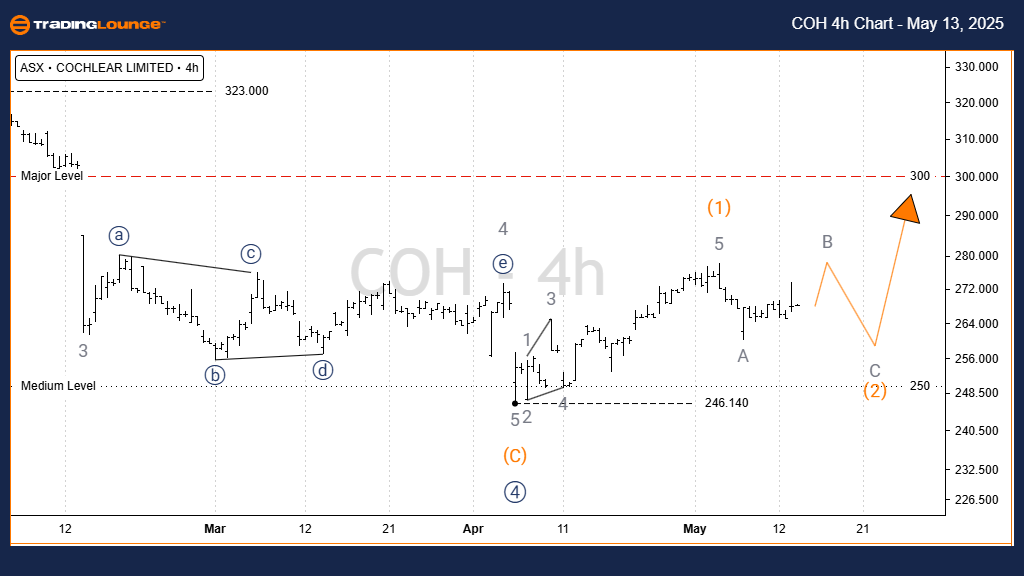
COCHLEAR LIMITED COH Elliott Wave Technical Analysis | TradingLounge (4-Hour Chart)

Chart Details:

Function: Major Trend (Intermediate degree, Orange)

Mode: Motive

Structure: Impulse

Position: Wave B - grey of (Wave 2) - orange

Technical Insight:
After the price found a base at 246.140, Wave 1) - orange shaped a Leading Diagonal. This configuration suggests that Wave 2) - orange could show a deep retracement. With Wave A of 2) completed, attention now turns to the development of Wave B and C - grey. A final decline is expected through Wave C - grey, setting the stage for a strong upside move in Wave 3) - orange.

Invalidation Point: 246.140

Technical Analyst: Hua (Shane) Cuong, CEWA-M (Master’s Designation).

Source: Visit Tradinglounge.com and learn from the Experts. Join TradingLounge Here 

See Previous: CAR GROUP LIMITED – CAR Elliott Wave Technical Analysis

VALUE Offer - Buy 1 Month & Get 3 Months!Click here

Access 7 Analysts Over 200 Markets Covered. Chat Room With Support

COH-4h-Crypto-chart-...


Conclusion:
This Cochlear stock Elliott Wave analysis integrates short-term technical signals with larger market trends, offering guidance for ASX:COH traders and investors. Key validation and invalidation zones are emphasized to enhance the reliability of this wave-based market projection. Our goal is to deliver a clear, professional COH price outlook aligned with established Elliott Wave principles.

Related

U.S. Dollar / Canadian Dollar Forex Pair - Elliott Wave Technical USDCAD Analysis Offers Valuable Insights for your Trading Strategy

U.S. Dollar / Canadian Dollar Forex Pair - Elliott Wave Technical USDCAD Analysis Offers Valuable Insights for your Trading Strategy

This article provides an in-depth analysis of USDCAD using the Elliott Wave theory. It covers both i...

Read More >
Bullish QUALCOMM Inc Elliott Wave Forecast: Daily Wave {iii} Strength at $150, 1‑Hour Wave (iv) Correction Sets Up Wave (v) Breakout

Bullish QUALCOMM Inc Elliott Wave Forecast: Daily Wave {iii} Strength at $150, 1‑Hour Wave (iv) Correction Sets Up Wave (v) Breakout

Bullish Elliott Wave analysis for QCOM shows wave {iii} progressing on the daily chart, with support...

Read More >
Meta Platforms Inc. Stocks Elliott Wave Technical Analysis - Charts show an ongoing Bullish Trend Highlighting key Resistance Levels

Meta Platforms Inc. Stocks Elliott Wave Technical Analysis - Charts show an ongoing Bullish Trend Highlighting key Resistance Levels

This analysis of Meta Platforms (META) provides a detailed Elliott Wave forecast, highlighting key r...

Read More >
LINKUSD Elliott Wave Analysis: Chainlink Price Forecast, Fibonacci Levels, Support and Resistance Insights for Crypto Traders

LINKUSD Elliott Wave Analysis: Chainlink Price Forecast, Fibonacci Levels, Support and Resistance Insights for Crypto Traders

LINK/USD Elliott Wave analysis to understand Chainlink's price movements and potential trends. E...

Read More >
Costco Wholesale Corp. (COST) Elliott Wave Chart Signals Start of Bearish Wave C with Key Support Levels and Trade Setup Potential

Costco Wholesale Corp. (COST) Elliott Wave Chart Signals Start of Bearish Wave C with Key Support Levels and Trade Setup Potential

Costco’s stock appears to have completed wave (B) near $1000. Elliott Wave analysis suggests a bear...

Read More >

$1 for 2 Weeks

then $29 a month!

What a Special Offer!

Trade Recommendations

Unleash the power of deversified trading with our comprehensive portfolio, covering 250+ markets:

  • Stock Trades
  • Crypto Trades
  • Forex Trades
  • Commodity Trades
Elliott Wave Analysis

Gain a competitive edge with expert insights and AI-powered Elliott Wave charting into:

  • Global Indices
  • US Stocks & ASX Stocks
  • Forex & Crypto
  • Commodities
Top-Notch Trading Tools

Equip yourself with the tools of success:

  • Real-time Chat rooms
  • Elliott Wave Algorithm
  • Portfolio tools
  • TradingLevels
  • Screener
  • Trading Game
7 Elliott Wave Analysts

Stay ahead of the market with daily charts and insightful videos
Your secret to strategic trading!

JOIN HERE


Welcome to TradingLounge (ASIC A.R.No. 321187), specialists in trades, trading education and technical analysis, covering stocks, indices, commodities, forex and cryptocurrencies.

When you join TradingLounge you have access to everything we offer, including trade tools, educational content and a social platform to chat with like-minded investors.

Read more

@Copyright 2024 by tradinglounge.com

Contact Us

Australian no: 02 4787 6020

International no: +61 (2) 47876020

Pay with:

Find us on