10Feb

ASX:NST Elliott Wave Analysis – Northern Star Resources Stock Forecast, Key Price Levels and Trading Strategies for Smart Investors

ASX: Northern Star Resources LTD. (NST) Elliott Wave Technical Analysis

Greetings,

This Elliott Wave analysis provides an updated outlook on Northern Star Resources Ltd (ASX:NST) and its market movement on the Australian Stock Exchange (ASX).

We observe potential upside movement for ASX:NST, but a pullback with Wave ((ii)) - navy is expected before Wave ((iii)) - navy advances. A shift in trend requires additional time, and this report outlines key price levels to help traders identify trend reversals and invalidation points.


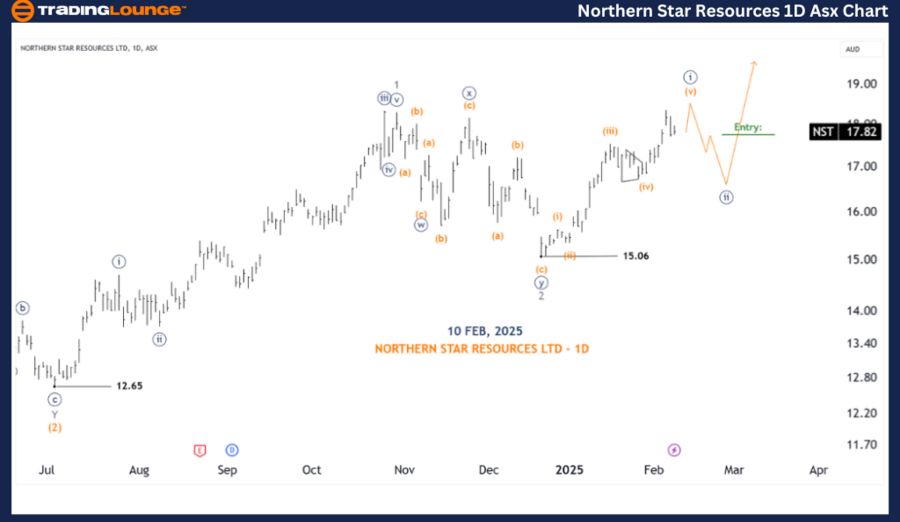
Northern Star Resources Ltd (NST) Elliott Wave Analysis (1D Chart - Semilog Scale)

ASX: Northern Star Resources Ltd 1D Chart Analysis - Semilog Scale

NST Stock Analysis Overview

Function: Major trend (Intermediate degree, orange)

Mode: Motive

Structure: Impulse

Position: Wave (v) - orange of Wave ((I)) - navy

NST Stock Technical Details

  • The Wave 2 - grey has likely completed as a Double Zigzag, and since hitting 15.06, Wave 3 - grey is moving upward.
  • Wave ((ii)) - navy appears close to completion, potentially leading to a rally with Wave ((iii)) - navy.
  • Wave ((i)) - navy is concluding its five-wave formation, setting up for a pullback with Wave ((ii)) - navy.
  • Traders may look for long entry positions after Wave ((ii)) - navy completes, confirming an uptrend when Wave B surges past a key resistance level.

NST Stock Key Technical Levels

  • Invalidation Point: 15.06

NORTHERN-STAR-RESOUR...


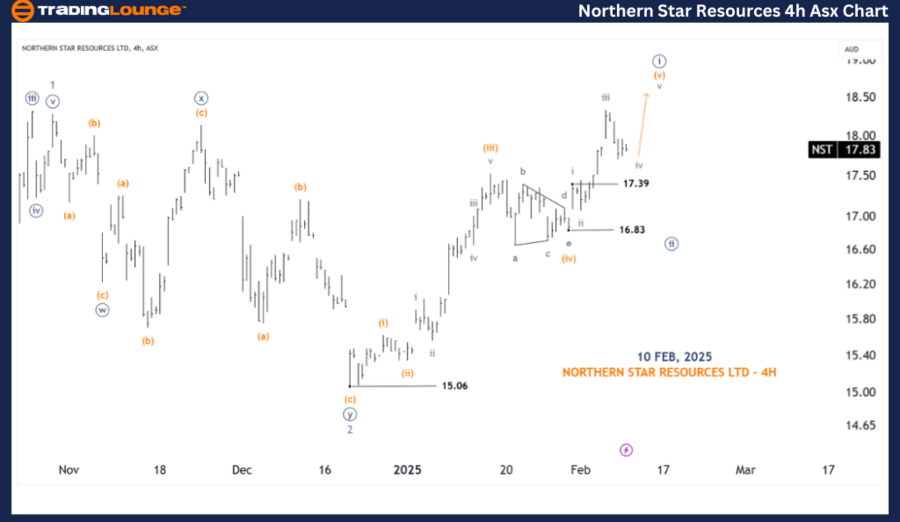
Northern Star Resources Ltd (NST) Elliott Wave Analysis (4h Chart - Semilog Scale)

ASX: Northern Star Resources Ltd 4h Chart Analysis Overview

  • Function: Major trend (Minute degree, navy)
  • Mode: Motive
  • Structure: Impulse
  • Position: Wave (v) - orange of Wave ((v)) - navy

Northern Star Resources Ltd Technical Details

  • Wave (v) - orange of Wave ((i)) - navy is approaching completion.

  • A pullback with Wave ((ii)) - navy is expected before resuming the uptrend with Wave ((iii)) - navy.
  • If the price drops below 17.39, it strongly suggests Wave ((ii)) - navy is still unfolding.

Northern Star Resources Ltd Key Technical Levels

  • Invalidation Point: 15.06

  • Key Support Level: 17.39

Technical Analyst: Hua (Shane) Cuong, CEWA-M (Master’s Designation).

Source: visit Tradinglounge.com and learn From the Experts Join TradingLounge Here 

See Previous: SANTOS LIMITED - STO Elliott Wave Technical Analysis

VALUE Offer - Buy 1 Month & Get 3 Months!Click here

Access 7 Analysts Over 200 Markets Covered. Chat Room With Support

NORTHERN-STAR-RESOUR...


Conclusion

This Elliott Wave analysis provides a structured market outlook and short-term forecast for ASX: Northern Star Resources Ltd (NST). We emphasize critical validation and invalidation price points, helping traders refine market confidence and decision-making.

By incorporating these technical insights, we aim to deliver an objective and professional perspective, empowering traders to strategically capitalize on market trends.

Related

British Pound/Japanese Yen(GBPJPY) Elliottwave Technical analysis - A Comprehensive Overview for Day and 4-Hour Charts

British Pound/Japanese Yen(GBPJPY) Elliottwave Technical analysis - A Comprehensive Overview for Day and 4-Hour Charts

This comprehensive guide offers an in-depth Elliott Wave analysis of the GBPJPY currency pair, provi...

Read More >
QCOM Elliott Wave Analysis: Qualcomm Stock Forecast, Bullish Trading Setup, and Investment Outlook Using Daily and 1H Charts

QCOM Elliott Wave Analysis: Qualcomm Stock Forecast, Bullish Trading Setup, and Investment Outlook Using Daily and 1H Charts

Get a full breakdown of QUALCOMM Inc. (QCOM) using Elliott Wave analysis. Discover the bullish trend...

Read More >
Wheat Commodity Elliott Wave Technical Analysis Explores Key Support, Resistance Levels, and Prices are in a Corrective Bounce

Wheat Commodity Elliott Wave Technical Analysis Explores Key Support, Resistance Levels, and Prices are in a Corrective Bounce

Wheat prices have bounced back but have remained in a long-term bearish trend since 2022. This Ellio...

Read More >
Euro Stoxx 50 Index Elliott Wave Technical Analysis Exhibits a Strong Bullish Trend on the Daily and Weekly Chart

Euro Stoxx 50 Index Elliott Wave Technical Analysis Exhibits a Strong Bullish Trend on the Daily and Weekly Chart

The Euro Stoxx 50 index exhibits a strong bullish trend on the weekly chart, with an impulsive Orang...

Read More >

$1 for 2 Weeks

then $29 a month!

What a Special Offer!

Trade Recommendations

Unleash the power of deversified trading with our comprehensive portfolio, covering 250+ markets:

  • Stock Trades
  • Crypto Trades
  • Forex Trades
  • Commodity Trades
Elliott Wave Analysis

Gain a competitive edge with expert insights and AI-powered Elliott Wave charting into:

  • Global Indices
  • US Stocks & ASX Stocks
  • Forex & Crypto
  • Commodities
Top-Notch Trading Tools

Equip yourself with the tools of success:

  • Real-time Chat rooms
  • Elliott Wave Algorithm
  • Portfolio tools
  • TradingLevels
  • Screener
  • Trading Game
7 Elliott Wave Analysts

Stay ahead of the market with daily charts and insightful videos
Your secret to strategic trading!

JOIN HERE


Welcome to TradingLounge (ASIC A.R.No. 321187), specialists in trades, trading education and technical analysis, covering stocks, indices, commodities, forex and cryptocurrencies.

When you join TradingLounge you have access to everything we offer, including trade tools, educational content and a social platform to chat with like-minded investors.

Read more

@Copyright 2024 by tradinglounge.com

Contact Us

Australian no: 02 4787 6020

International no: +61 (2) 47876020

Pay with:

Find us on