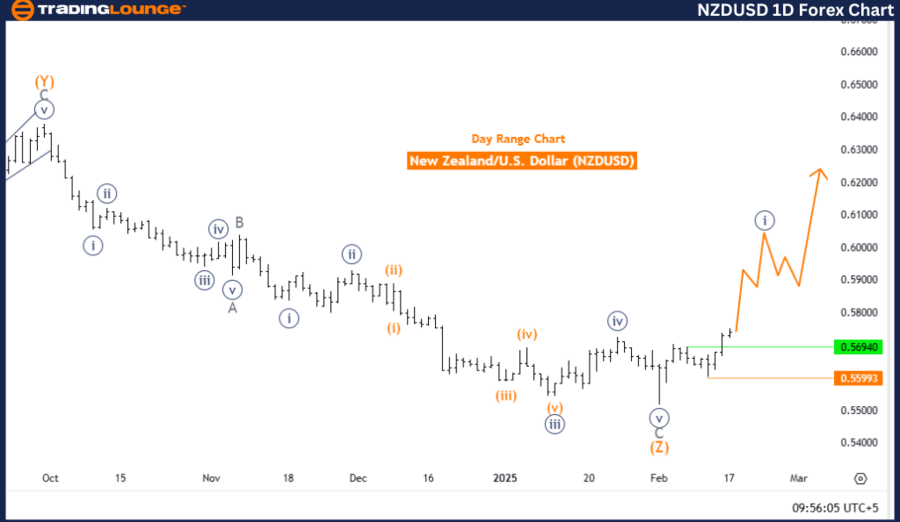
New Zealand Dollar / U.S. Dollar (NZDUSD) Elliott Wave Analysis – Trading Lounge Daily Chart
NZDUSD Elliott Wave Technical Analysis
Function: Bullish Trend
Mode: Impulsive
Structure: Navy Blue Wave 1
Position: Gray Wave 1
Next Lower Degree Wave: Navy Blue Wave 2
Wave Cancel Invalid Level: 0.55993
Market Overview
The NZDUSD daily chart indicates a strong bullish trend, driven by an impulsive wave structure. The market is currently positioned in Navy Blue Wave 1, signaling the early stage of an upward cycle. This development suggests growing momentum, increasing the likelihood of further price appreciation in the short term.
The wave positioning places the market in Gray Wave 1, further confirming the beginning of a broader bullish movement. As long as Navy Blue Wave 1 remains intact, the bullish trajectory is expected to continue, supporting long-position traders.
Next Wave Projection
The next wave to watch is Navy Blue Wave 2, expected to emerge after the completion of the current bullish leg. This wave may introduce temporary consolidation or a corrective phase before the market resumes its overall upward momentum.
Conclusion
The NZDUSD daily chart reflects a firm bullish sentiment, with Navy Blue Wave 1 of Gray Wave 1 still evolving. The next phase, Navy Blue Wave 2, may bring a short-term pullback, offering potential entry opportunities before the longer-term bullish trend resumes.
Traders should monitor the wave cancel invalid level of 0.55993, as a decline below this point would invalidate the current Elliott Wave count and indicate a potential shift in market structure.
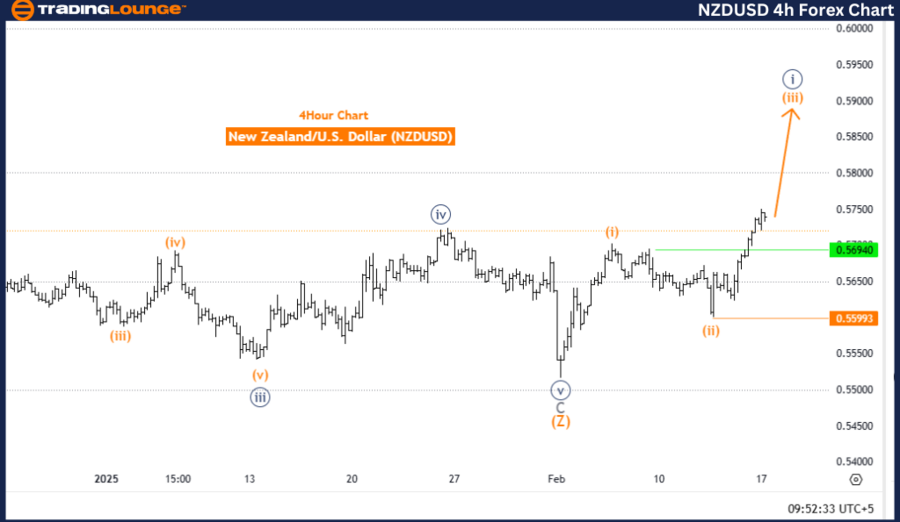
New Zealand Dollar / U.S. Dollar (NZDUSD) Elliott Wave Analysis – Trading Lounge 4-Hour Chart
NZDUSD Elliott Wave Technical Analysis
Function: Bullish Trend
Mode: Impulsive
Structure: Orange Wave 3
Position: Navy Blue Wave 1
Next Lower Degree Wave: Orange Wave 4
Wave Cancel Invalid Level: 0.55993
Market Overview
The NZDUSD 4-hour chart confirms a strong bullish trend with an impulsive wave structure. The market is currently developing Orange Wave 3, which follows the completion of Orange Wave 2. This signals rising bullish momentum, strengthening the case for continued gains in the pair.
The current wave structure places the market within Navy Blue Wave 1, further reinforcing the early stages of a broader uptrend. As Orange Wave 3 progresses, the market is likely to sustain its bullish movement before transitioning into Orange Wave 4.
Next Wave Projection
The next wave to monitor is Orange Wave 4, expected to form after Orange Wave 3 completes. This suggests that after the current bullish push, the market may enter a temporary correction or consolidation before the broader uptrend resumes.
Conclusion
The NZDUSD 4-hour chart continues to reflect a strong bullish trend, with Orange Wave 3 currently in progress. The upcoming phase, Orange Wave 4, could introduce a short-term pullback, potentially presenting buying opportunities before the uptrend continues.
As long as the wave structure remains intact, further bullish movement is expected in the near term. However, traders should watch the wave cancel invalid level of 0.55993, as a decline below this level would invalidate the current Elliott Wave count and suggest a potential trend reversal.
Technical Analyst: Malik Awais
Source: visit Tradinglounge.com and learn From the Experts Join TradingLounge Here
Previous: USDCAD Elliott Wave Technical Analysis
VALUE Offer - Buy 1 Month & Get 3 Months!Click here
Access 7 Analysts Over 200 Markets Covered. Chat Room With Support