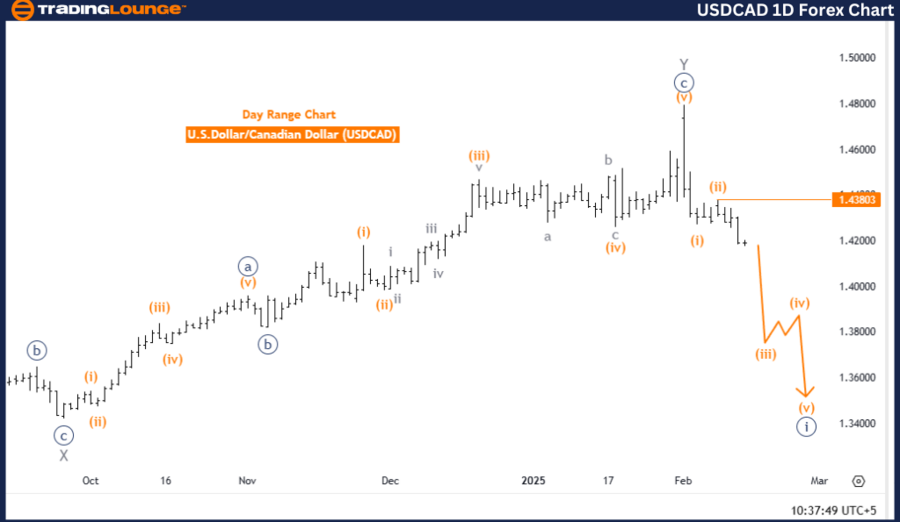
U.S. Dollar / Canadian Dollar (USDCAD) Elliott Wave Analysis – Trading Lounge Daily Chart Analysis
USDCAD Elliott Wave Technical Analysis
Function: Bearish Trend
Mode: Impulsive
Structure: Orange Wave 3
Position: Navy Blue Wave 1
Next Higher Degree Direction: Orange Wave 4
Invalidation Level: 1.43803
Analysis Overview
The USDCAD daily chart signals a strong bearish trend, characterized by an impulsive wave structure. Currently, the market is in orange wave 3, following the completion of orange wave 2. This suggests that downward momentum remains dominant, reinforcing expectations for further declines.
At its present position in navy blue wave 1, the broader downtrend is still developing. As orange wave 3 unfolds, price action is projected to continue declining before transitioning into a corrective phase in orange wave 4.
The next higher-degree wave to monitor is orange wave 4, which will emerge upon completion of the ongoing bearish move. This phase may introduce a temporary pullback or consolidation before the larger downtrend resumes.
The key invalidation level for this Elliott Wave structure is 1.43803. If the price breaches this level, the bearish wave count would require reassessment. However, as long as USDCAD remains below 1.43803, the bearish scenario remains valid, with further downside pressure anticipated.
Conclusion
The USDCAD daily chart continues to reflect a strong bearish trend, with orange wave 3 currently in progress. The 1.43803 level acts as a critical resistance point, confirming the bearish outlook. The next key development in the Elliott Wave sequence is orange wave 4, which could result in a short-term correction before the dominant downtrend resumes.
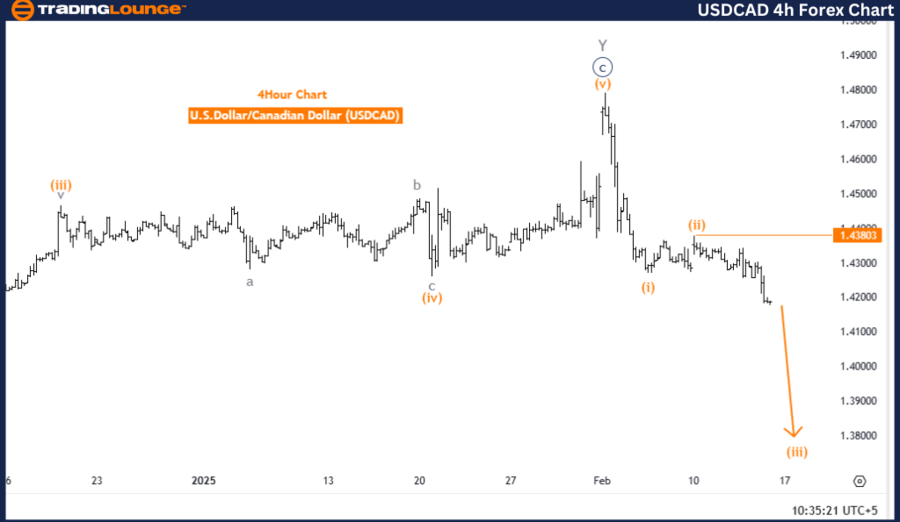
U.S. Dollar / Canadian Dollar (USDCAD) 4-Hour Chart Analysis
USDCAD Elliott Wave Technical Analysis
Function: Bearish Trend
Mode: Impulsive
Structure: Orange Wave 3
Position: Navy Blue Wave 1
Next Higher Degree Direction: Orange Wave 4
Invalidation Level: 1.43803
Analysis Overview
The USDCAD 4-hour chart aligns with the bearish trend, confirming a strong impulsive wave structure. The market is currently in orange wave 3, following the completion of orange wave 2, indicating that downward momentum remains intact with further losses likely.
The navy blue wave 1 position reinforces that the broader downtrend is in its early stages. As orange wave 3 progresses, price action is expected to continue declining, eventually transitioning into a corrective phase in orange wave 4.
The next higher-degree wave to watch is orange wave 4, which will follow the completion of the ongoing downward move. This phase may result in a temporary pullback or consolidation before the bearish trend resumes.
The critical invalidation level for this Elliott Wave setup is 1.43803. If price action surpasses this threshold, the bearish wave count would need reevaluation. However, as long as USDCAD trades below 1.43803, the bearish outlook remains strong, with further downside movement expected.
Conclusion
The USDCAD 4-hour chart maintains a strong bearish bias, with orange wave 3 currently driving price action downward. The 1.43803 resistance level serves as a key validation point for the bearish scenario. The upcoming Elliott Wave phase, orange wave 4, may introduce a short-term recovery before the primary downtrend resumes.
Technical Analyst: Malik Awais
Source: visit Tradinglounge.com and learn From the Experts Join TradingLounge Here
Previous: AUDUSD Elliott Wave Technical Analysis
VALUE Offer - Buy 1 Month & Get 3 Months!Click here
Access 7 Analysts Over 200 Markets Covered. Chat Room With Support