KO Elliott Wave Analysis: Trading Lounge Daily and 4-Hour Charts

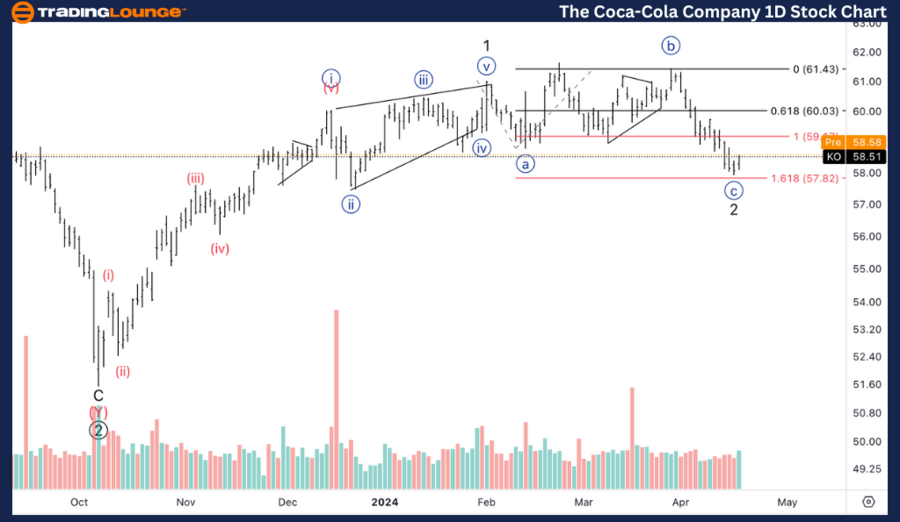
The Coca-Cola Company (KO) Daily Chart Analysis

KO Elliott Wave Technical Analysis

Overview of Current Elliott Wave Structure and Market Position:

Function: Counter Trend

Mode: Corrective

Structure: Flat

Current Position: Minute wave {c} of 2.

Directional Analysis: Potential Bottom in Wave {c}

Detailed Insights: During the recent trading session, a notable spike in volume was observed on the bullish side, suggesting that the corrective phase might be concluding or is close to completion. This is further underscored by the price approaching the 1.618 Fibonacci extension of wave {c} relative to wave {a}. Crucially, prices have touched the base level of the leading diagonal from wave 1, a common area for finding support.

Coca-Cola-1D-Stock-C...


Elliott Wave Technical Considerations for Short-Term Traders:

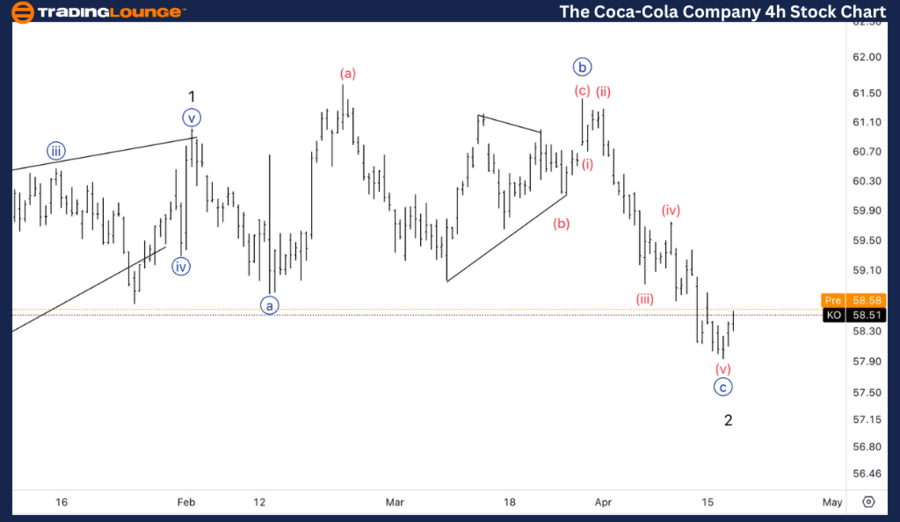
The Coca-Cola Company (KO) 4-Hour Chart Analysis

Function: Counter Trend

Mode: Corrective

Structure: Flat

Current Position: Wave (v) of {c}.

Directional Analysis: Anticipated Bottom in Wave (v)

Intraday Technical Outlook: The 4-hour chart provides a clearer view of the five-wave structure within wave {c}, which appears to have unfolded as anticipated. Analysts are now closely monitoring for a definitive sign that a bottom has been established.

Technical Analyst: Alessio Barretta

Source: visit Tradinglounge.com and learn From the Experts Join TradingLounge Here 

See Previous: The TJX Companies Inc., (TJX) 

TradingLounge Once Off SPECIAL DEAL: Here > 1 month Get 3 months.

TradingLounge's Free Week Extravaganza!

April 14 – 21: Unlock the Doors to Trading Excellence — Absolutely FREE

Coca-Cola-4H-Stock-C...

Investment Implications and Forward-Looking Analysis:

Both the daily and 4-hour charts of The Coca-Cola Company (KO) reveal important Elliott Wave technical patterns that suggest a nearing end to the current corrective phase, particularly in wave {c}. For investors and traders utilizing Elliott Wave analysis, these insights are crucial for making informed decisions. The observed volume spike and the technical support level hint at a potential reversal or stabilization, which could offer strategic entry points for those looking to capitalize on the impending trend shifts.

Related

Comprehensive AUDUSD Elliott Wave Forecast: Daily Bullish Impulse & 4‑Hour Corrective Wave Insight for Traders

Comprehensive AUDUSD Elliott Wave Forecast: Daily Bullish Impulse & 4‑Hour Corrective Wave Insight for Traders

Comprehensive AUDUSD Elliott Wave analysis outlining bullish impulsive structure on the daily chart ...

Read More >
U.S.Dollar/Swiss Franc (USD/CHF) Elliott Wave Technical Analysis Trading Lounge: In-Depth Technical Insights

U.S.Dollar/Swiss Franc (USD/CHF) Elliott Wave Technical Analysis Trading Lounge: In-Depth Technical Insights

Our USD/CHF Elliott Wave Analysis provides traders with valuable insights into the current market dy...

Read More >
Capitalize on Uniswap’s Market Momentum: Uniswap Crypto Price News Today UNIUSD Elliott Wave Technical Analysis

Capitalize on Uniswap’s Market Momentum: Uniswap Crypto Price News Today UNIUSD Elliott Wave Technical Analysis

Discover the latest UNIUSD Elliott Wave analysis and Uniswap price prediction. This guide provides i...

Read More >
State Bank of India (SBI) Stock: Elliott Wave Analysis, Technical Indicators, and Future Price Projections for Informed Trading

State Bank of India (SBI) Stock: Elliott Wave Analysis, Technical Indicators, and Future Price Projections for Informed Trading

This article provides an in-depth Elliott Wave analysis of State Bank of India's stock, highligh...

Read More >
Visa Inc. (V) Stocks Elliott Wave Technical Analysis: Price Prediction, Key Levels, and Trading Opportunities

Visa Inc. (V) Stocks Elliott Wave Technical Analysis: Price Prediction, Key Levels, and Trading Opportunities

This analysis covers Visa Inc. (V) using Elliott Wave theory, offering insights into its current wav...

Read More >
British Pound to US Dollar Forex Currency Pair: GBPUSD Forex Elliott Wave Technical Analysis

British Pound to US Dollar Forex Currency Pair: GBPUSD Forex Elliott Wave Technical Analysis

This article provides a thorough GBPUSD Elliott Wave Analysis, covering essential aspects such as pr...

Read More >

$1 for 2 Weeks

then $29 a month!

What a Special Offer!

Trade Recommendations

Unleash the power of deversified trading with our comprehensive portfolio, covering 250+ markets:

  • Stock Trades
  • Crypto Trades
  • Forex Trades
  • Commodity Trades
Elliott Wave Analysis

Gain a competitive edge with expert insights and AI-powered Elliott Wave charting into:

  • Global Indices
  • US Stocks & ASX Stocks
  • Forex & Crypto
  • Commodities
Top-Notch Trading Tools

Equip yourself with the tools of success:

  • Real-time Chat rooms
  • Elliott Wave Algorithm
  • Portfolio tools
  • TradingLevels
  • Screener
  • Trading Game
7 Elliott Wave Analysts

Stay ahead of the market with daily charts and insightful videos
Your secret to strategic trading!

JOIN HERE


Welcome to TradingLounge (ASIC A.R.No. 321187), specialists in trades, trading education and technical analysis, covering stocks, indices, commodities, forex and cryptocurrencies.

When you join TradingLounge you have access to everything we offer, including trade tools, educational content and a social platform to chat with like-minded investors.

Read more

@Copyright 2024 by tradinglounge.com

Contact Us

Australian no: 02 4787 6020

International no: +61 (2) 47876020

Pay with:

Find us on