17Apr

The TJX Companies Inc.Elliott Wave Technical Analysis: Insight into Trading Opportunities

Here's an Elliott Wave perspective on The TJX Companies Inc. (TJX) as of April 17, 2024, detailed through analyses on both the daily and 4-hour charts:

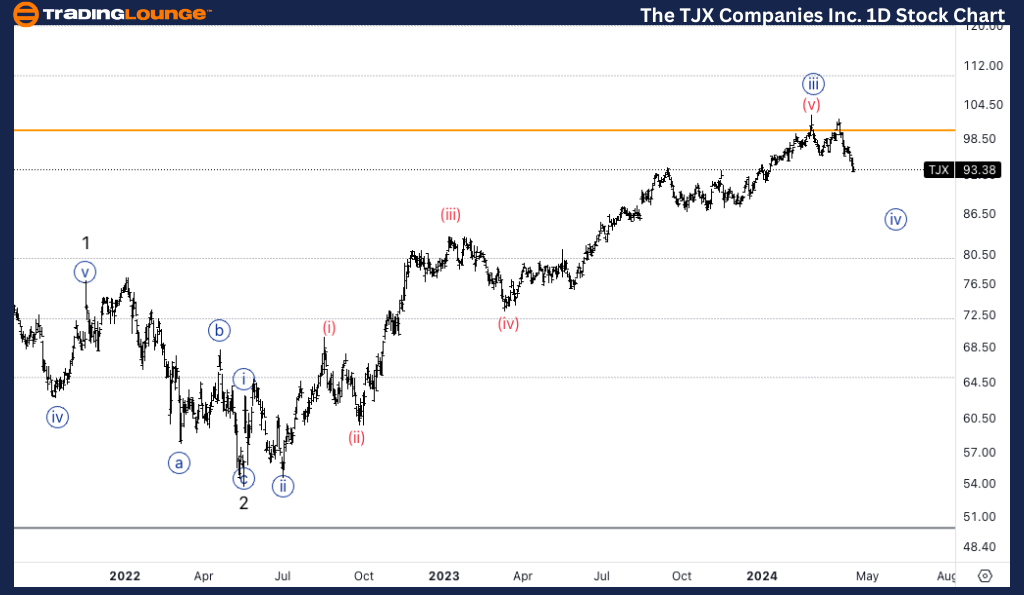
TJX Elliott Wave Analysis Trading Lounge Daily Chart, 

The TJX Companies Inc., (TJX) Daily Chart

TJX Elliott Wave Technical Analysis

FUNCTION: CounterTrend

MODE: Corrective

STRUCTURE: ZigZag

POSITION:  Minute wave {iv}.

DIRECTION: Bottom in wave {iv}.

DETAILS: As we seem to be unfolding in Minor wave 5, we have found resistance at TL1 at 100$, and we will not look for long trades before we will found support on 100$.  

TJX Elliott Wave Technical Analysis – Daily Chart

TJX is currently positioned in a countertrend, corrective phase under a ZigZag structure, specifically in Minute wave {iv}. This indicates a potential bottom forming in wave {iv}. Currently, resistance was encountered at TL1, located at $100. The analysis suggests caution, recommending against initiating long positions until a support is clearly established at or near $100, indicating the completion of wave {iv} and a potential setup for the subsequent upward move in Minor wave 5.

The-TJX-1D-Stock-Cha...


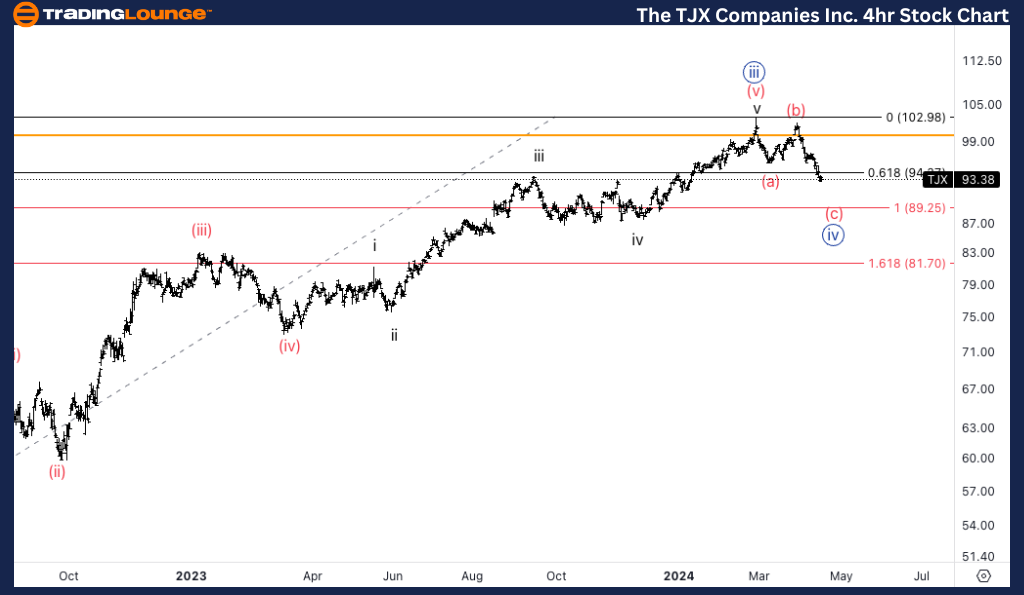
TJX Elliott Wave Analysis Trading Lounge 4H Chart, 

The TJX Companies Inc., (TJX) 4H Chart

TJX Elliott Wave Technical Analysis

FUNCTION: CounterTrend

MODE: Corrective

STRUCTURE: ZigZag

POSITION: Wave (c) of {iv}.

DIRECTION: Bottom in wave (c).

DETAILS: I outlined equality of wave {ii} and {iv}, as correction of the same degree will tend towards equality, at 89$. We can clearly we demand at that level, looking to see at least a reaction.

TJX Elliott Wave Technical Analysis – 4hr Chart

On the 4-hour chart, TJX is seen in the final stages of its corrective phase, specifically in wave (c) of {iv}. This detailed view continues with the ZigZag corrective pattern, focusing on the price action towards a potential bottom. The chart notes the price target of $89, where the wave (c) could find equality with wave (ii) — a common scenario in corrections of the same degree. There's a noted demand at this level, suggesting that a reversal or significant reaction could be expected soon.

Technical Analyst: Alessio Barretta

Source: visit Tradinglounge.com and learn From the Experts Join TradingLounge Here 

See Previous: Salesforce Inc., (CRM) Stock Analysis

TradingLounge Once Off SPECIAL DEAL: Here > 1 month Get 3 months.

TradingLounge's Free Week Extravaganza!

April 14 – 21: Unlock the Doors to Trading Excellence — Absolutely FREE

The-TJX-4HR-Stock-Ch...

Related

EURUSD Elliott Wave Forecast: Bullish Impulse Wave 1 Setup Near Completion With Pullback and Trend Continuation Expected

EURUSD Elliott Wave Forecast: Bullish Impulse Wave 1 Setup Near Completion With Pullback and Trend Continuation Expected

EURUSD is showing a bullish impulsive wave structure. Wave 1 is near completion, suggesting a pullba...

Read More >
 Advanced Micro Devices (AMD) Elliott Wave Forecast Reveals Bullish Price Action and Key Chart Levels and Stock Market Analysts

Advanced Micro Devices (AMD) Elliott Wave Forecast Reveals Bullish Price Action and Key Chart Levels and Stock Market Analysts

This analysis explores AMD's bullish Elliott Wave structure across daily and hourly charts, high...

Read More >
ASX: BLOCK INC (SQ2) Elliott Wave Stock Forecast with Key Support and Trading Strategy for Bullish Wave (3) Setup

ASX: BLOCK INC (SQ2) Elliott Wave Stock Forecast with Key Support and Trading Strategy for Bullish Wave (3) Setup

ASX: BLOCK INC (SQ2) shows bullish potential under Elliott Wave analysis. Stay above 76.54 for wave ...

Read More >
NIFTY 50 Elliott Wave Forecast Shows Ongoing Bullish Momentum with Wave 3 and 1 on Daily and Weekly Technical Charts

NIFTY 50 Elliott Wave Forecast Shows Ongoing Bullish Momentum with Wave 3 and 1 on Daily and Weekly Technical Charts

This article presents a comprehensive Elliott Wave analysis of the NIFTY 50 Index, utilising both da...

Read More >
Profitable HSI Trading with Hang Seng Index Elliott Wave Technical Analysis, HSI Market Trends, and Top Investment Tips

Profitable HSI Trading with Hang Seng Index Elliott Wave Technical Analysis, HSI Market Trends, and Top Investment Tips

This article provides an in-depth Hang Seng trading and HSI analysis, offering insights into Elliott...

Read More >

$1 for 2 Weeks

then $29 a month!

What a Special Offer!

Trade Recommendations

Unleash the power of deversified trading with our comprehensive portfolio, covering 250+ markets:

  • Stock Trades
  • Crypto Trades
  • Forex Trades
  • Commodity Trades
Elliott Wave Analysis

Gain a competitive edge with expert insights and AI-powered Elliott Wave charting into:

  • Global Indices
  • US Stocks & ASX Stocks
  • Forex & Crypto
  • Commodities
Top-Notch Trading Tools

Equip yourself with the tools of success:

  • Real-time Chat rooms
  • Elliott Wave Algorithm
  • Portfolio tools
  • TradingLevels
  • Screener
  • Trading Game
7 Elliott Wave Analysts

Stay ahead of the market with daily charts and insightful videos
Your secret to strategic trading!

JOIN HERE


Welcome to TradingLounge (ASIC A.R.No. 321187), specialists in trades, trading education and technical analysis, covering stocks, indices, commodities, forex and cryptocurrencies.

When you join TradingLounge you have access to everything we offer, including trade tools, educational content and a social platform to chat with like-minded investors.

Read more

@Copyright 2024 by tradinglounge.com

Contact Us

Australian no: 02 4787 6020

International no: +61 (2) 47876020

Pay with:

Find us on