JSW STEEL – JSWSTEEL Elliott Wave Analysis (1D Chart)

JSWSTEEL 1 Day Chart Analysis

JSWSTEEL Elliott Wave Technical Analysis

Function: Larger Degree Trend Higher (Intermediate Degree Orange)

Mode: Motive

Structure: Impulse

Position:Minute Wave ((iv)) Navy

Details:

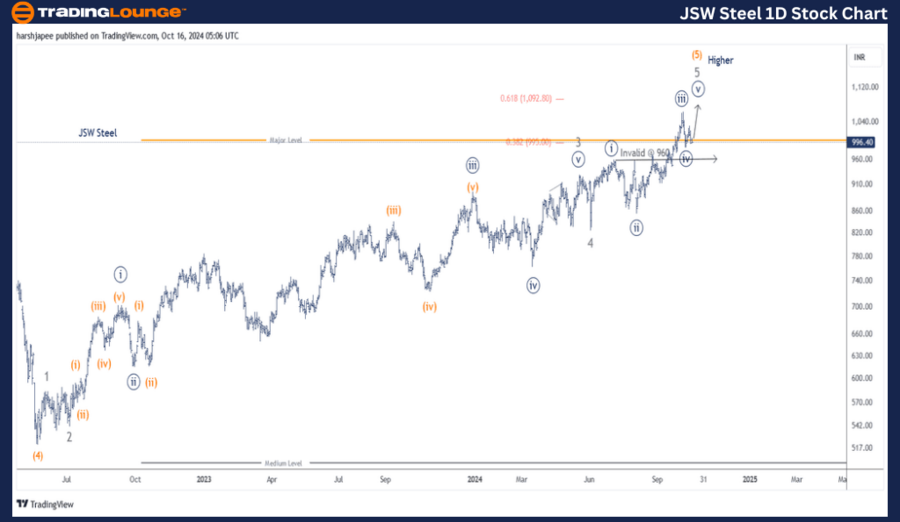
Minute Wave ((iv)) Navy is currently correcting lower or has potentially completed around the 980 mark, within Minor Wave 5 of Intermediate Wave (5) Orange. The potential target is towards the 1093 mark.

Invalidation Point: 960 (Risk tightened)

JSW Steel Daily Chart Technical Analysis and Elliott Wave Counts

The daily chart for JSW Steel indicates a potential upward push towards the 1093 mark, signaling the completion of Minute Wave ((v)) Navy of Minor Wave 5 Grey within Intermediate Wave (5) Orange. This push may terminate at multiple degrees around the 1093 mark, suggesting a larger correction could follow.

Since May 2022, JSW Steel stock has been rising from lows around 520 (Intermediate Wave (4) Orange). Minor Wave 3 extended, and Minute Wave ((iii)) of 3 also saw an extension. Minor Wave 4 Grey ended near 830 on June 04, 2024.

Minor Wave 5 has been unfolding from the 830 lows, with a potential push towards 1093. Minute Waves ((i)) through ((iv)) appear complete, and the stock is expected to move higher soon. It is crucial that the stock holds above 960 to maintain the impulse structure.

JSW-Steel-1D-Stock-C...


JSW STEEL – JSWSTEEL Elliott Wave Technical Analysis (4H Chart)

JSWSTEEL Stock Technical Analysis

Function: Larger Degree Trend Higher (Intermediate Degree Orange)

Mode: Motive

Structure: Impulse

Position: Minute Wave ((iv)) Navy

Details: 

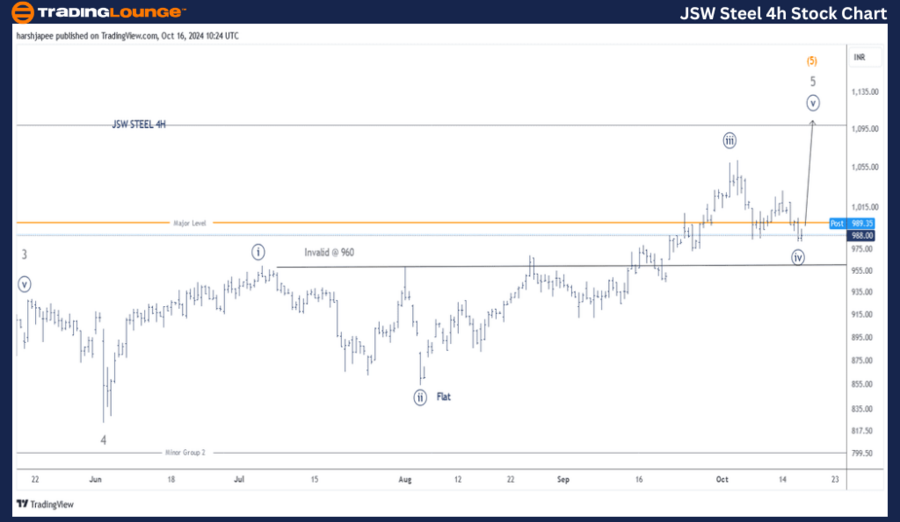
Minute Wave ((iv)) Navy is either in a correction lower or potentially completed around the 980 mark, within Minor Wave 5 of Intermediate Wave (5) Orange. If correct, Minute Wave ((v)) is expected to resume higher soon towards the potential target of 1093.

Invalidation Point: 960

JSW Steel 4H Chart Technical Analysis and Elliott Wave Counts

The 4H chart of JSW Steel highlights the sub-waves following Minor Wave 4's low near 830. A potential impulse appears underway, targeting the 1093 level, with the key level remaining around 960.

Technical Analyst: Harsh Japee

Source: visit Tradinglounge.com and learn From the Experts Join TradingLounge Here 

Previous: Grasim Industries Elliott Wave Technical Analysis 

VALUE Offer - Buy 1 Month & Get 3 Months!Click here

Access 7 Analysts Over 200 Markets Covered. Chat Room With Support

JSW-Steel-4h-Stock-C...


Conclusion

JSW Steel is advancing towards the 1093 mark as Minute Wave ((v)) is expected to resume within Minor Wave 5 Grey of Intermediate Wave (5) Orange, provided the stock stays above 960.

Related

Dogecoin / U.S. dollar(DOGEUSD) Elliott Wave Technical Analysis 6 November 23

Dogecoin / U.S. dollar(DOGEUSD) Elliott Wave Technical Analysis 6 November 23

Dogecoin / U.S. dollar(DOGEUSD) Elliott Wave Technical Analysis 6 November 23, Dogecoin / U.S. dolla...

Read More >
A Technical Breakdown: Bitcoin Crypto Price News Today Bitcoin/U.S. Dollar (BTCUSD) Elliott Wave Technical Analysis

A Technical Breakdown: Bitcoin Crypto Price News Today Bitcoin/U.S. Dollar (BTCUSD) Elliott Wave Technical Analysis

This article provides a detailed Elliott Wave Analysis of the Bitcoin/U.S. Dollar (BTCUSD) trading p...

Read More >
Mahindra & Mahindra Elliott Wave Technical Analysis: Stock Price Prediction, Bullish Trend Forecast & Trading Strategy Insights

Mahindra & Mahindra Elliott Wave Technical Analysis: Stock Price Prediction, Bullish Trend Forecast & Trading Strategy Insights

Elliott Wave analysis of Mahindra & Mahindra stock, covering daily and weekly chart insights. Learn ...

Read More >
NEOUSD Elliott Wave Technical Analysis: Where we break down NEO's Price Movements, Trading Strategies, and Key Indicators

NEOUSD Elliott Wave Technical Analysis: Where we break down NEO's Price Movements, Trading Strategies, and Key Indicators

Explore the comprehensive NEOUSD Elliott Wave analysis, where we break down NEO's price movement...

Read More >
VeChain / U.S. dollar(VETUSD) Elliott Wave Technical Analysis 26 January 24

VeChain / U.S. dollar(VETUSD) Elliott Wave Technical Analysis 26 January 24

TradingLounge Daily Chart and 4-Hour Chart for VeChain/U.S. dollar Elliott Wave Technical Analysis d...

Read More >
Cardano (ADA) Elliott Wave Analysis Shows Bullish Wave 3 Targeting $0.685 with Key Fibonacci Levels and Swing Trade Strategy

Cardano (ADA) Elliott Wave Analysis Shows Bullish Wave 3 Targeting $0.685 with Key Fibonacci Levels and Swing Trade Strategy

ADA Elliott Wave technical analysis reveals completion of Waves 1 and 2 on both daily and 4H charts....

Read More >

$1 for 2 Weeks

then $29 a month!

What a Special Offer!

Trade Recommendations

Unleash the power of deversified trading with our comprehensive portfolio, covering 250+ markets:

  • Stock Trades
  • Crypto Trades
  • Forex Trades
  • Commodity Trades
Elliott Wave Analysis

Gain a competitive edge with expert insights and AI-powered Elliott Wave charting into:

  • Global Indices
  • US Stocks & ASX Stocks
  • Forex & Crypto
  • Commodities
Top-Notch Trading Tools

Equip yourself with the tools of success:

  • Real-time Chat rooms
  • Elliott Wave Algorithm
  • Portfolio tools
  • TradingLevels
  • Screener
  • Trading Game
7 Elliott Wave Analysts

Stay ahead of the market with daily charts and insightful videos
Your secret to strategic trading!

JOIN HERE


Welcome to TradingLounge (ASIC A.R.No. 321187), specialists in trades, trading education and technical analysis, covering stocks, indices, commodities, forex and cryptocurrencies.

When you join TradingLounge you have access to everything we offer, including trade tools, educational content and a social platform to chat with like-minded investors.

Read more

@Copyright 2024 by tradinglounge.com

Contact Us

Australian no: 02 4787 6020

International no: +61 (2) 47876020

Pay with:

Find us on