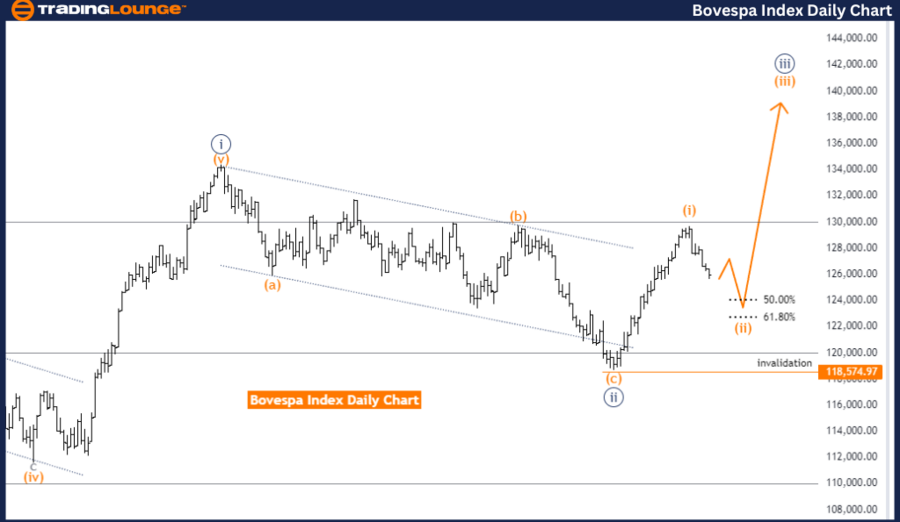
Bovespa Index Elliott Wave Technical Analysis Daily Chart
Function: Counter Trend
Mode: Corrective
Structure: Orange Wave 2
Position: Navy Blue Wave 3
Direction Next Higher Degrees: Orange Wave 3
Bovespa Index Elliott Wave Technical Analysis
The Bovespa Index Elliott Wave Analysis on the daily chart suggests the market is in a counter-trend phase, which is corrective in nature. The focus is on Orange Wave 2, positioned within Navy Blue Wave 3. This indicates the market is undergoing a corrective wave (Orange Wave 2) within a larger trend wave (Navy Blue Wave 3).
The analysis indicates that the next higher degree movement will be Orange Wave 3. Once the current corrective phase (Orange Wave 2) concludes, the market is expected to shift into Orange Wave 3, typically an impulsive move aligned with the overall trend.
Orange Wave 1 is identified as complete, and the market is now in Orange Wave 2 of 3. This transition suggests that after the initial impulsive wave (Orange Wave 1), the market entered the corrective phase (Orange Wave 2) within the larger impulsive structure (Navy Blue Wave 3). The end of Wave 1 establishes a new market direction, with Wave 2 representing a temporary retracement before continuing the trend in Wave 3.
The critical wave cancellation invalid level is set at 118574.97. This level is essential as it validates the current wave structure. A drop below this level would invalidate the current wave analysis, suggesting the need for a revised assessment of the wave pattern.
Summary: The Bovespa Index daily chart shows the market in a counter-trend corrective phase within Orange Wave 2, positioned in Navy Blue Wave 3. With Orange Wave 1 complete, the market is now in the corrective phase of Orange Wave 2. After this phase, a transition into Orange Wave 3 is expected, continuing the primary trend. The wave cancel invalid level is 118574.97, a key validation threshold for the current wave analysis.
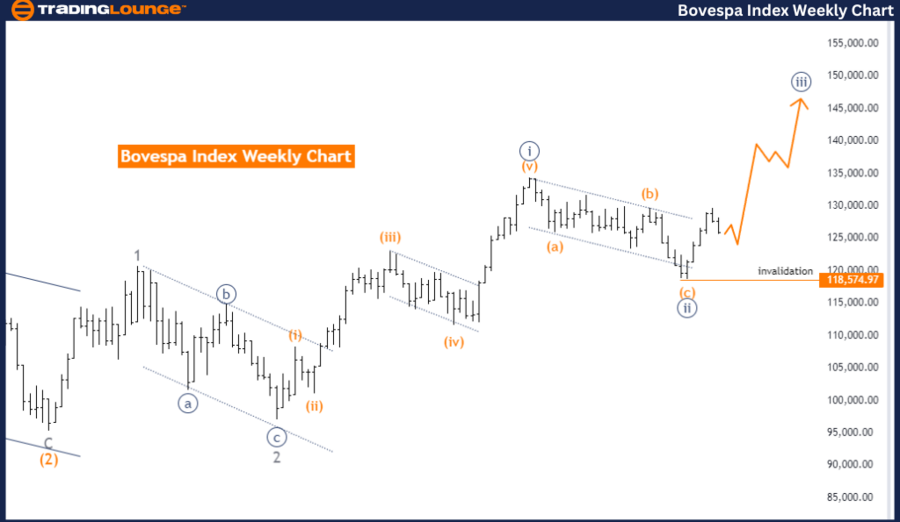
Bovespa Index Elliott Wave Analysis Trading Lounge Weekly Chart
Bovespa Index Elliott Wave Technical Analysis
Function: Trend
Mode: Impulsive
Structure: Navy Blue Wave 3
Position: Gray Wave 3
Direction Next Lower Degrees: Navy Blue Wave 4
The weekly chart analysis of the Bovespa Index indicates the market is in an impulsive trend phase, characterized by Navy Blue Wave 3 within Gray Wave 3. This setup suggests the market is experiencing the third wave of a larger third wave, typically a strong and extended movement in the trend's direction.
The analysis foresees the next lower degree movement as Navy Blue Wave 4. After the ongoing impulsive phase (Navy Blue Wave 3), the market is projected to enter Navy Blue Wave 4, a corrective phase that follows an impulsive wave.
Navy Blue Wave 2 is identified as complete, with Navy Blue Wave 3 of 3 now in play. This indicates that the market has moved past the second corrective wave (Navy Blue Wave 2) and entered the third impulsive wave (Navy Blue Wave 3) within the larger impulsive wave (Gray Wave 3). The completion of Wave 2 suggests a continuation of the primary trend, with Wave 3 expected to extend this trend strongly.
The wave cancellation invalid level is also set at 118574.97. This level serves as a crucial validation point for the current wave structure. If the market drops below this level, it would invalidate the current wave analysis, necessitating a reassessment of the wave pattern.
Summary: The Bovespa Index weekly chart analysis shows the market in an impulsive trend phase within Navy Blue Wave 3, positioned in Gray Wave 3. With Navy Blue Wave 2 complete, the market is now in the impulsive phase of Navy Blue Wave 3. Following this phase, the market is expected to enter a corrective phase in Navy Blue Wave 4. The wave cancel invalid level is 118574.97, serving as a critical threshold for validating the current wave analysis.
Technical Analyst: Malik Awais
Source: visit Tradinglounge.com and learn From the Experts Join TradingLounge Here
See previous: Euro Stoxx 50 Composite Elliott Wave Analysis
Special Trial Offer - 0.76 Cents a Day for 3 Months! Click here
Access 7 Analysts Over 170 Markets Covered. Chat Room With Support