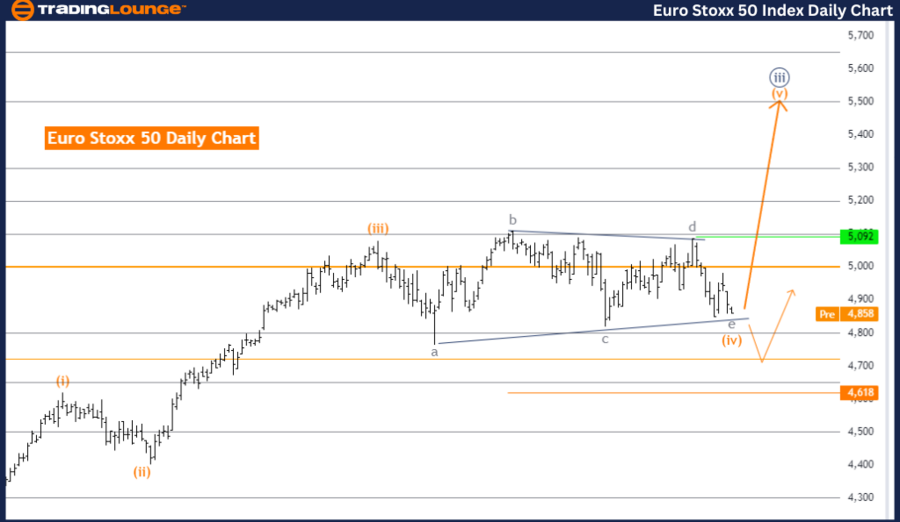
Euro Stoxx 50 Elliott Wave Analysis - Day Chart
Euro Stoxx 50 Day Chart Analysis
Euro Stoxx 50 Elliott Wave Technical Analysis
- Function: Counter Trend
- Mode: Corrective
- Structure: Orange Wave 4
- Position: Navy Blue Wave 3
- Direction Next Higher Degrees: Orange Wave 5
- Details: Orange Wave 4 is currently unfolding in a sideways movement. Wave Cancel Invalid Level: 4618
The Euro Stoxx 50 day chart analysis indicates that the market is experiencing a counter-trend phase. This phase is marked by a corrective mode, suggesting a temporary pause or reversal in the ongoing trend. The current wave structure under analysis is Orange Wave 4, situated within Navy Blue Wave 3. This position suggests the market is in the fourth wave of a larger sequence, typically involving consolidation or a corrective movement before the trend's final leg.
The analysis forecasts that the next higher degree direction is Orange Wave 5. After the current corrective phase (Orange Wave 4) concludes, the market is expected to transition into Orange Wave 5, resuming the primary trend direction and likely leading to further price increases.
Detailed observations indicate that Orange Wave 4 is still evolving, characterized by a sideways movement. This suggests the market is in a consolidation phase with limited directional momentum, typical of a corrective wave that moves sideways rather than trending strongly in one direction.
A critical aspect of this analysis is the wave cancellation invalid level, set at 4618. This level acts as a crucial threshold for validating the current wave structure. If the market price drops below this point, it would invalidate the current wave analysis, indicating that the anticipated wave pattern is no longer valid and requires reassessment.
Summary: The Euro Stoxx 50 day chart shows the market in a corrective counter-trend phase within Orange Wave 4, positioned in Navy Blue Wave 3. The market is currently consolidating sideways, and after this phase completes, it is expected to transition into Orange Wave 5, resuming the primary trend direction. The wave cancel invalid level is 4618, serving as a critical validation point for the current wave analysis.
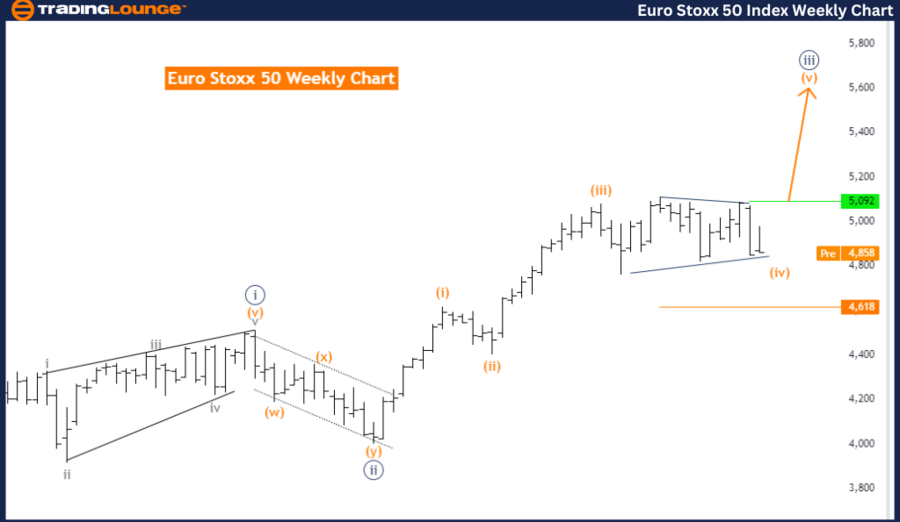
Euro Stoxx 50 Elliott Wave Analysis - Weekly Chart
Euro Stoxx 50 Weekly Chart Analysis
Euro Stoxx 50 Elliott Wave Technical Analysis
- Function: Counter Trend
- Mode: Corrective
- Structure: Orange Wave 4
- Position: Navy Blue Wave 3
- Direction Next Higher Degrees: Orange Wave 5
- Details: Orange Wave 4 is still developing as a sideways movement.
- Wave Cancel Invalid Level: 4618
The Euro Stoxx 50 weekly chart analysis reveals that the market is in a counter-trend phase. This phase, categorized as corrective, indicates a temporary pause or reversal within a larger trend. The current wave structure under analysis is Orange Wave 4, situated within Navy Blue Wave 3. This positioning implies the market is in the fourth wave of a broader sequence, typically involving a corrective or consolidative movement.
The analysis suggests that the next higher degree direction will be Orange Wave 5. Following the completion of the current corrective phase (Orange Wave 4), the market is expected to move into Orange Wave 5, resuming the main trend and potentially leading to further upward price movements.
A key detail is that Orange Wave 4 is still unfolding, manifesting as a sideways movement. This indicates the market is in a consolidation phase, with limited directional momentum, characteristic of a corrective wave that moves horizontally rather than strongly trending in either direction.
An important point to note is the wave cancel invalid level, set at 4618. This level is crucial as it serves as a validation point for the current wave structure. If the market price falls below this level, it would invalidate the current wave analysis, signaling that the expected wave pattern is no longer applicable and that the analysis needs to be revised.
Summary: The Euro Stoxx 50 weekly chart analysis indicates the market is in a corrective counter-trend phase within Orange Wave 4, situated in Navy Blue Wave 3. The market is consolidating sideways, and upon completion of this phase, it is expected to transition into Orange Wave 5, resuming the primary trend direction. The wave cancel invalid level is 4618, serving as a critical threshold for validating the current wave analysis.
Special Trial Offer - 0.76 Cents a Day for 3 Months! Click here
Access 7 Analysts Over 170 Markets Covered. Chat Room With Support