07Apr

S&P 500 Elliott Wave Analysis Reveals SPX Impulse Patterns, and Trading Strategies for Market Volatility Insights

S&P 500 Elliott Wave Analysis – Trading Lounge Daily Chart

S&P 500 Index Elliott Wave Technical Analysis

Technical Overview

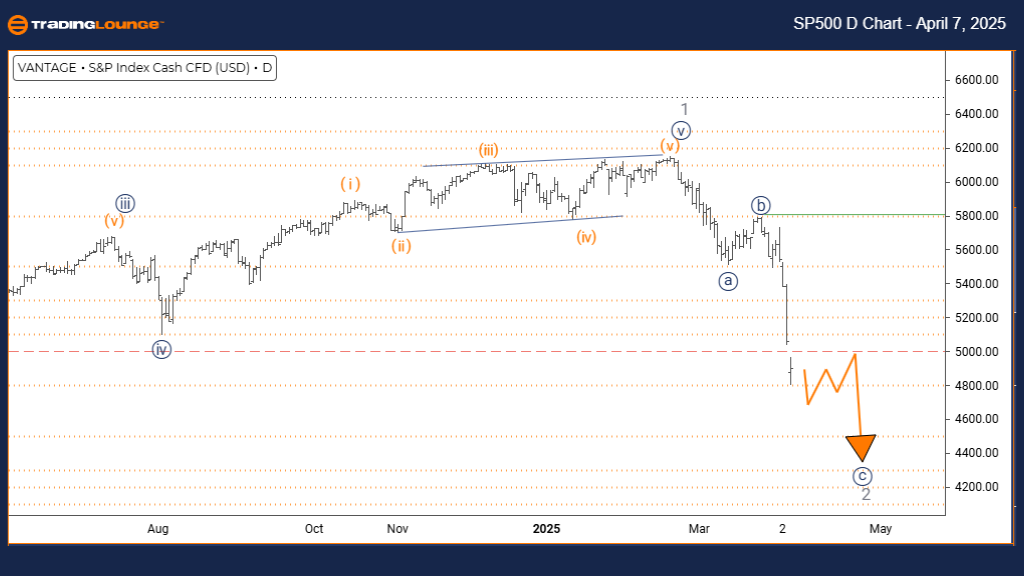
Function: Counter-Trend Mode: Impulsive (Wave C) Wave Structure: Navy Blue Wave C Current Position: Gray Wave 2 Next Higher Degree: Gray Wave 3

S&P 500 Elliott Wave Summary – Daily Perspective

The S&P 500 is currently navigating a counter-trend move, progressing through navy blue wave C, which forms part of the broader gray wave 2 structure. The preceding navy blue wave B has likely concluded, initiating this impulsive leg within a corrective cycle. As this phase unfolds, wave C is expected to maintain an impulsive pattern, aligning with typical characteristics seen in the final segments of corrections. This development may help define the broader structural bottom ahead of gray wave 3.

Analytical Insights

Wave C patterns usually develop as five-wave impulsive structures, often wrapping up larger corrections. Investors should watch for signs of wave completion to plan timely entries or exits. Recognizing the wave's placement within the full structure is vital for tactical and strategic decisions.

Trading Implications

This daily chart outlook delivers valuable insights for those managing short-term market fluctuations. With the S&P 500 in a corrective wave, traders and investors should factor in the larger Elliott Wave structure when planning their strategies. Awareness of key wave levels can guide better risk management and trade setups.

SP500-1d-index-chart...


S&P 500 Elliott Wave Analysis -Trading Lounge Weekly Chart

Technical Overview

Function: Counter-Trend Mode: Corrective Wave Structure: Navy Blue Wave C Current Position: Gray Wave 2 Next Higher Degree: Gray Wave 3 Invalidation Level: 3497.72

S&P 500 Elliott Wave Summary – Weekly Perspective

On the weekly timeframe, the S&P 500 remains in a corrective counter-trend movement, progressing through navy blue wave C, within the gray wave 2 structure. The previous wave B correction has ended, confirming the current wave C advance. This wave C is anticipated to evolve as a corrective formation, typically involving three-wave movements or sideways action. The key invalidation level is marked at 3497.72—a breach would challenge the current wave count.

Analytical Insights

Navy blue wave C shapes the intermediate trend within the gray wave 2 phase. Watching for the end of this wave is critical before anticipating the potential turn into gray wave 3. The weekly view enhances long-term strategy alignment and short-term evaluation.

Trading Implications

This chart supports a measured outlook for long-term investors and swing traders. As the corrective phase continues, understanding wave dynamics will be crucial to confirm market transitions and prepare for the upcoming gray wave 3 rally.

Technical Analyst: Malik Awais

Source: visit Tradinglounge.com and learn From the Experts Join TradingLounge Here 

Previous: Bovespa Elliott Wave Technical Analysis

VALUE Offer - Buy 1 Month & Get 3 Months!Click here

Access 7 Analysts Over 200 Markets Covered. Chat Room With Support

SP500-weekly-index-c...

Related

Promising trends according to Ethereum/ U.S. dollar(ETHUSD) Elliott Wave Technical Analysis

Promising trends according to Ethereum/ U.S. dollar(ETHUSD) Elliott Wave Technical Analysis

Ethereum's performance against the U.S. dollar (ETHUSD) is analyzed through Elliott Wave analysi...

Read More >
Silver Price Forecast for 2024: Elliott Wave Technical Analysis, Bullish Trends, Key Price Levels, and Market Movement Insights

Silver Price Forecast for 2024: Elliott Wave Technical Analysis, Bullish Trends, Key Price Levels, and Market Movement Insights

This article delves into a comprehensive Silver price forecast for 2024 using Elliott Wave analysis....

Read More >
Uniswap/U.S. dollar(UNIUSD) Elliott Wave Technical Analysis 16 January 24

Uniswap/U.S. dollar(UNIUSD) Elliott Wave Technical Analysis 16 January 24

Uniswap/U.S. dollar(UNIUSD) Elliott Wave Technical Analysis dated 16 January 24, Uniswap / U.S. doll...

Read More >
Learn about the Polkadot Crypto Market Trends, and Trading Strategies with DOTUSD Elliott Wave Technical Analysis

Learn about the Polkadot Crypto Market Trends, and Trading Strategies with DOTUSD Elliott Wave Technical Analysis

Discover in-depth Polkadot (DOTUSD) Elliott Wave analysis and price predictions. Learn about the lat...

Read More >
British Pound / Australian Dollar (GBPAUD) Elliott Wave Technical Forecast: Bullish Trend Setup, Daily and 4-Hour Chart Outlook

British Pound / Australian Dollar (GBPAUD) Elliott Wave Technical Forecast: Bullish Trend Setup, Daily and 4-Hour Chart Outlook

GBPAUD Elliott Wave analysis focusing on the ongoing wave 2 correction within a larger bullish wave ...

Read More >
Ripple XRP Crypto Price News Today and In-Depth XRPUSD Elliott Wave Technical Analysis, Detailing Potential Trade Setups

Ripple XRP Crypto Price News Today and In-Depth XRPUSD Elliott Wave Technical Analysis, Detailing Potential Trade Setups

This analysis provides an in-depth XRP Elliott Wave forecast, detailing the XRPUSD technical outlook...

Read More >

$1 for 2 Weeks

then $29 a month!

What a Special Offer!

Trade Recommendations

Unleash the power of deversified trading with our comprehensive portfolio, covering 250+ markets:

  • Stock Trades
  • Crypto Trades
  • Forex Trades
  • Commodity Trades
Elliott Wave Analysis

Gain a competitive edge with expert insights and AI-powered Elliott Wave charting into:

  • Global Indices
  • US Stocks & ASX Stocks
  • Forex & Crypto
  • Commodities
Top-Notch Trading Tools

Equip yourself with the tools of success:

  • Real-time Chat rooms
  • Elliott Wave Algorithm
  • Portfolio tools
  • TradingLevels
  • Screener
  • Trading Game
7 Elliott Wave Analysts

Stay ahead of the market with daily charts and insightful videos
Your secret to strategic trading!

JOIN HERE


Welcome to TradingLounge (ASIC A.R.No. 321187), specialists in trades, trading education and technical analysis, covering stocks, indices, commodities, forex and cryptocurrencies.

When you join TradingLounge you have access to everything we offer, including trade tools, educational content and a social platform to chat with like-minded investors.

Read more

@Copyright 2024 by tradinglounge.com

Contact Us

Australian no: 02 4787 6020

International no: +61 (2) 47876020

Pay with:

Find us on