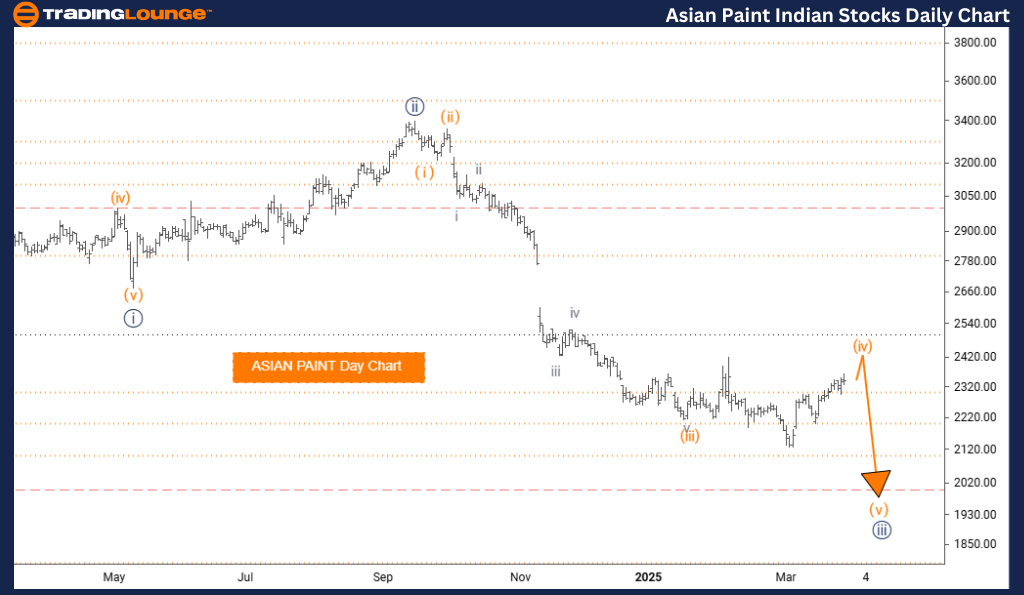
ASIAN PAINT Elliott Wave Analysis – Trading Lounge Day Chart
ASIAN PAINT Elliott Wave Technical Analysis
Function: Counter Trend
Mode: Corrective
Structure: Orange Wave 4
Position: Navy Blue Wave 3
Direction (Next Lower Degrees): Orange Wave 5
Details: Orange Wave 3 appears complete; Orange Wave 4 is now active
Daily Chart Overview:
ASIAN PAINT's daily Elliott Wave analysis signals a counter-trend correction, with the focus currently on Orange Wave 4. This wave forms part of the larger Navy Blue Wave 3 in the broader wave cycle. The completion of Orange Wave 3 marks the transition into a corrective pattern, aligning with typical Elliott Wave movement before continuation of the larger trend.
Wave Structure Insight:
This corrective wave development signifies a temporary pause in the prevailing uptrend. The daily timeframe provides valuable visibility into this phase, enabling informed trading decisions. Once Orange Wave 4 completes, expectations turn to the emergence of Orange Wave 5, likely resuming the upward trend in ASIAN PAINT stock.
Technical Note:
The current analysis identifies Orange Wave 4 as a key part of the Navy Blue Wave 3 structure. This phase may feature classic corrective behavior such as a three-wave pattern or sideways movement. Traders should track these features for signs of a reversal and the next upward leg.
Conclusion:
Traders are encouraged to await confirmation of the corrective wave’s end before initiating new positions. This pullback within Orange Wave 4 may present favorable setups for both short-term strategies and long-term investment opportunities aligned with the overall trend direction.
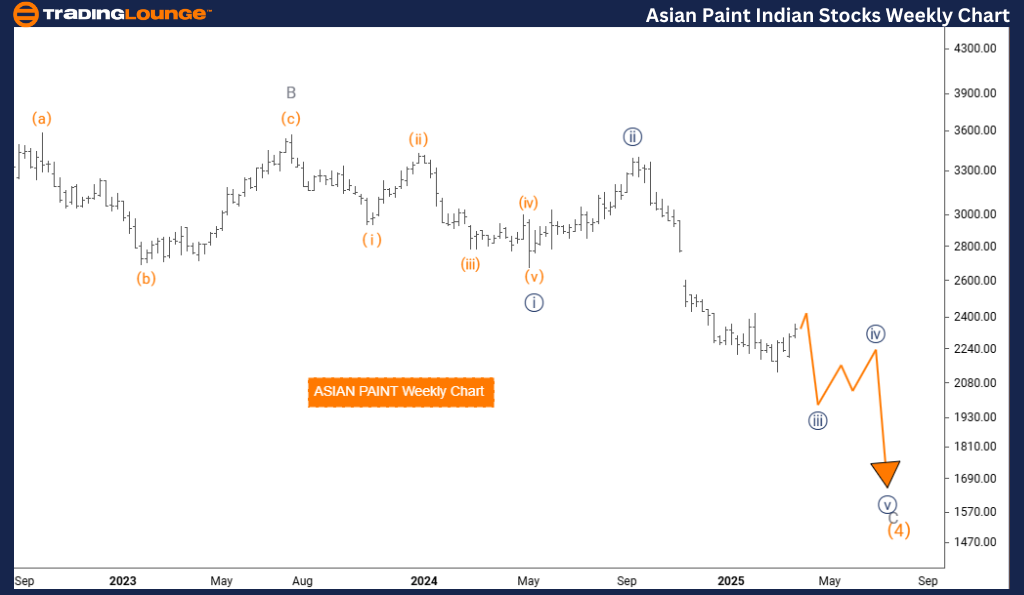
ASIAN PAINT Elliott Wave Analysis – Trading Lounge Weekly Chart
ASIAN PAINT Elliott Wave Technical Analysis
Function: Counter Trend
Mode: Impulsive
Structure: Navy Blue Wave 3
Position: Gray Wave C of 4
Direction (Next Higher Degrees): Navy Blue Wave 4
Details: Navy Blue Wave 3 appears complete; it is currently unfolding further
Weekly Chart Overview:
On the weekly chart, ASIAN PAINT shows a counter-trend Elliott Wave formation with bullish implications. The focus is on Navy Blue Wave 3, nested within Gray Wave C of the larger Orange Wave 4 structure. With a potential completion of Navy Blue Wave 3, the market appears to continue its complex wave formation, suggesting an extended corrective scenario.
Wave Structure Insight:
The weekly timeframe captures a more expansive view, showing impulsive behavior in Navy Blue Wave 3 within a broader correction. This dynamic often appears in Wave C structures during corrective phases. Once complete, the shift toward Navy Blue Wave 4 is expected, offering a setup for the next major price move.
Technical Note:
This evaluation illustrates how Navy Blue Wave 3 functions as both a standalone pattern and a component of the larger corrective setup. Traders should keep an eye on signals of wave completion, which could trigger the beginning of Navy Blue Wave 4 and influence future trade positioning.
Conclusion:
The weekly analysis supports strategic planning for position traders. Recognizing the complexity of the current wave structure in ASIAN PAINT can aid in aligning trades with macro trend shifts. Monitoring the completion of the ongoing phase could unlock key trading and investment opportunities.
Technical Analyst: Malik Awais
Source: visit Tradinglounge.com and learn From the Experts Join TradingLounge Here
Previous: KOTAK BANK Elliott Wave Technical Analysis
VALUE Offer - Buy 1 Month & Get 3 Months!Click here
Access 7 Analysts Over 200 Markets Covered. Chat Room With Support