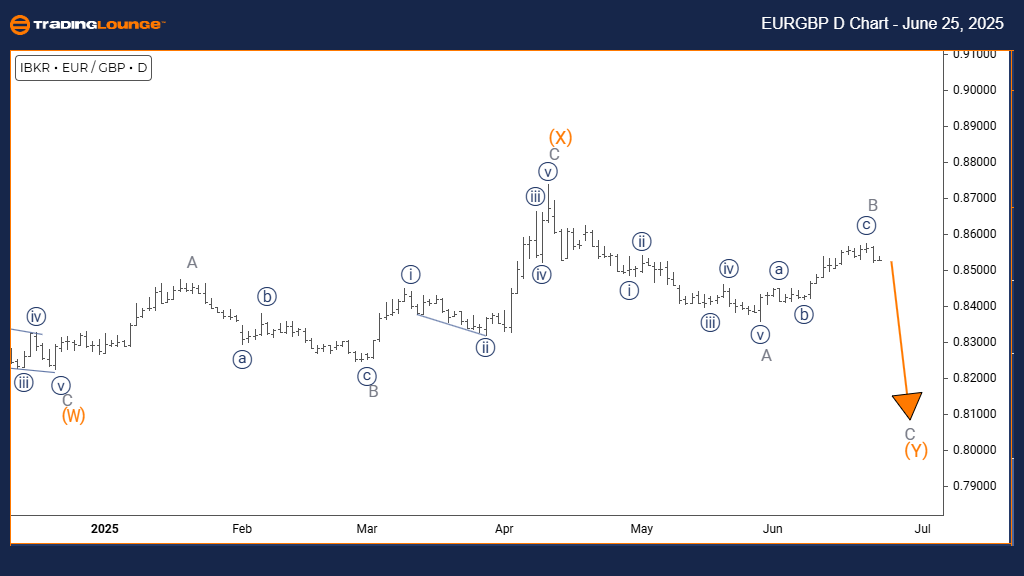
Euro / British Pound (EURGBP) Elliott Wave Analysis | Trading Lounge Daily Chart
EURGBP Elliott Wave Technical Analysis
Function: Counter Trend
Mode: Corrective
Structure: Gray Wave C
Position: Orange Wave Y
Direction Next Lower Degrees: Gray Wave C (in progress)
Details: Gray Wave B has likely ended; Gray Wave C is currently unfolding.
Wave Structure Overview
The EURGBP daily chart presents a corrective wave pattern, indicating a counter-trend scenario. The market is retracing within a larger structure, with Gray Wave C forming as part of the ongoing Orange Wave Y sequence. This setup points to a temporary corrective move, potentially preceding a return to the dominant trend.
Corrective Development
With Gray Wave B appearing complete, attention turns to Gray Wave C's development. This wave phase typically retraces a portion of the prior gains made during Wave B. As Gray Wave C progresses, the structure remains consistent with typical Elliott Wave correction dynamics, possibly leading to the next directional move upon completion.
Market Implications
During the evolution of Gray Wave C, traders should anticipate potential range-bound conditions and smaller retracements. As the pair resides within Orange Wave Y, this movement aligns with broader corrective characteristics. Key focus remains on identifying when Gray Wave C finalizes, as this may signal the emergence of a new price trend.
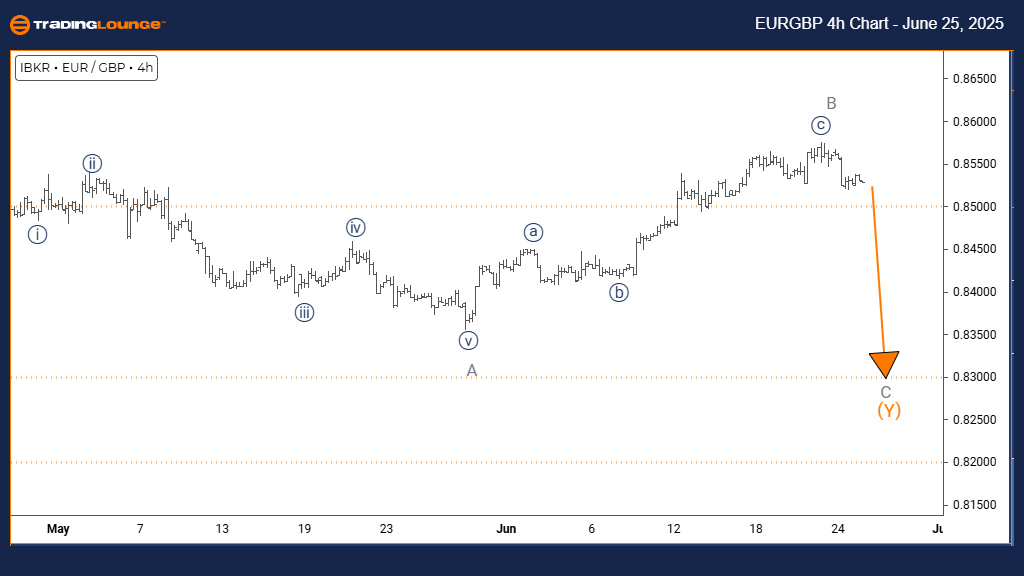
Euro / British Pound (EURGBP) Elliott Wave Analysis | Trading Lounge 4-Hour Chart
EURGBP Elliott Wave Technical Analysis
Function: Counter Trend
Mode: Corrective
Structure: Gray Wave C
Position: Orange Wave Y
Direction Next Lower Degrees: Gray Wave C (active)
Details: Gray Wave B looks complete; Gray Wave C is currently forming.
Wave Structure Overview
On the 4-hour chart, EURGBP continues within a defined corrective structure. Gray Wave C is active, developing within the broader Orange Wave Y framework. This structure matches classic counter-trend price activity, suggesting temporary consolidation ahead of potential trend resumption.
Outlook and Strategy
The conclusion of Gray Wave B has initiated the Gray Wave C leg. Traders can expect moderate fluctuations or sideways movements in this phase. As the structure progresses, signals of completion in Gray Wave C will be critical in forecasting the next significant move for the EURGBP pair.
Technical Analyst: Malik Awais
Source: Visit Tradinglounge.com and learn from the Experts. Join TradingLounge Here
Previous: AUDUSD Elliott Wave Technical Analysis
VALUE Offer - Buy 1 Month & Get 3 Months!Click here
Access 7 Analysts Over 200 Markets Covered. Chat Room With Support