HCL TECHNOLOGIES – HCLTECH (1D Chart) Elliott Wave Technical Analysis
HCLTECH Elliott Wave Technical Analysis
Function: Counter Trend (Minor Degree, Grey)
Mode: Corrective
Structure: Impulse within Larger Degree Correction
Position: Minute Wave ((i)) Navy
Technical Overview:
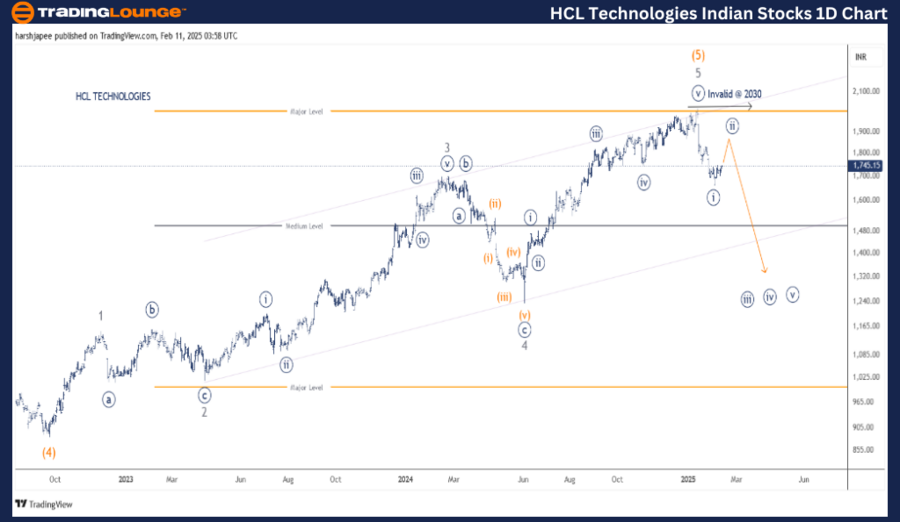
- Current Wave Progression: Minute Wave ((i)) appears to have completed around the 1640-1650 range.
- Expected Price Movement: A corrective rally towards the 1900 zone is anticipated before bearish momentum resumes.
- Key Invalidation Point: If prices break above 2030, the current wave structure will be invalidated.
HCL TECHNOLOGIES Daily Chart – Elliott Wave Analysis & Forecast
HCL TECHNOLOGIES' daily chart suggests a potential top formation around 2030, marking the termination of Intermediate Wave (5) Orange. The stock has since reversed, breaking below the 1750 support level, confirming the completion of a Minute Wave ((i)) impulse and signaling a deeper correction ahead.
Key Observations:
- In September 2022, HCLTECH plunged to 890 lows alongside global tech declines.
- A subsequent five-wave rally at the Minor Degree, labeled Waves 1 through 5, culminated at 2030 in January 2025.
- Since then, bearish momentum has taken over, with sellers maintaining control as long as the stock remains below 2030.
HCL TECHNOLOGIES – HCLTECH (4H Chart) Elliott Wave Technical Analysis
Function: Counter Trend (Minor Degree, Grey)
Mode: Corrective
Structure: Impulse within Larger Degree Correction
Position: Minute Wave ((i)) Navy
Technical Overview:
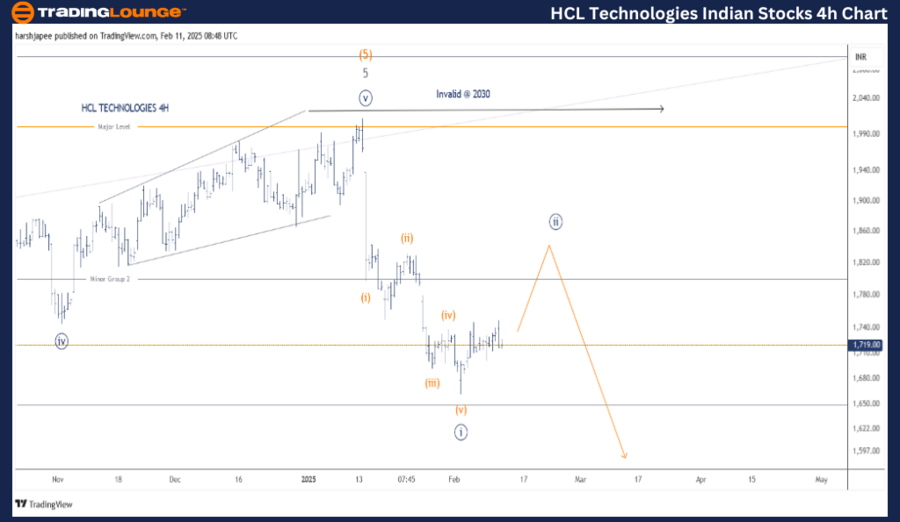
- Wave Completion: Minute Wave ((i)) seems to have finalized around 1640-1650, subdividing into five waves at the Minuette degree.
- Projected Movement: A corrective rally towards 1850-1900 before bearish dominance resumes.
- Invalidation Point: If the stock exceeds 2030, the Elliott Wave count will require reassessment.
HCL TECHNOLOGIES 4H Chart – Elliott Wave Analysis & Forecast
The 4-hour chart highlights the completion of Minute Wave ((iv)) within Minor Wave 5 Grey, which peaked at 1750 in November 2024. Subsequently, Minute Wave ((v)) developed as a diagonal, briefly pushing past 2030 before reversing.
Key Insights:
- The price has since dropped to 1665 lows, aligning with an impulsive Minute Wave ((i)) structure.
- If this count holds, Minute Wave ((ii)) is now unfolding, targeting 1850-1900, before the bearish trend resumes.
- Prices must stay below 2030 for this count to remain valid.
Technical Analyst: Harsh Japee
Source: visit Tradinglounge.com and learn From the Experts Join TradingLounge Here
Previous: BAJAJ FINSRV Elliott Wave Technical Analysis
VALUE Offer - Buy 1 Month & Get 3 Months!Click here
Access 7 Analysts Over 200 Markets Covered. Chat Room With Support
Conclusion:
HCL TECHNOLOGIES appears to be forming a corrective Minute Wave ((ii)), expected to reach 1850 before resuming its downward trend. Investors should monitor key resistance levels and the 2030 invalidation point to validate the Elliott Wave structure.