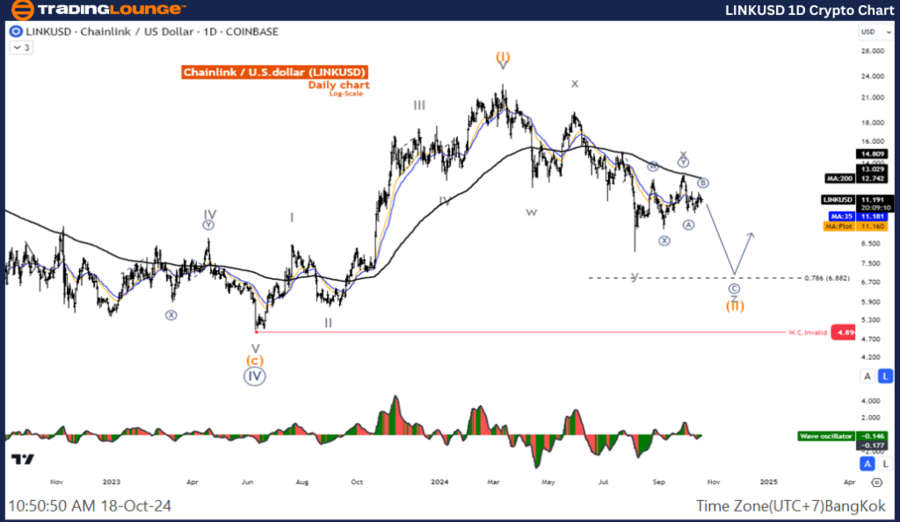
LINKUSD Elliott Wave Analysis – TradingLounge Day Chart

ChainLink/ U.S. dollar (LINKUSD) Day Chart Analysis

LINKUSD Elliott Wave Technical Analysis

Function: Counter Trend

Mode: Corrective

Structure: Triple Corrective

Position: Wave Z

Direction Next Higher Degrees: Wave ((II)) of Impulse

Wave Cancel Invalid Level: N/A

Details: Wave (II) is expected to retest the 6.882 level.

ChainLink/ U.S. Dollar (LINKUSD) Trading Strategy

The ongoing correction in Wave ((2)) is not complete. Current analysis suggests a decline toward the 6.882 level. However, this movement is considered a short-term pullback. Traders should anticipate a resumption of the uptrend following this correction.

ChainLink/ U.S. Dollar (LINKUSD) Technical Indicators

  • The price is currently trading below the MA200, signaling a downtrend.
  • The Wave Oscillator indicates bullish momentum, suggesting potential upward movement after the correction phase.

LINKUSD-1D-Crypto-Ch...


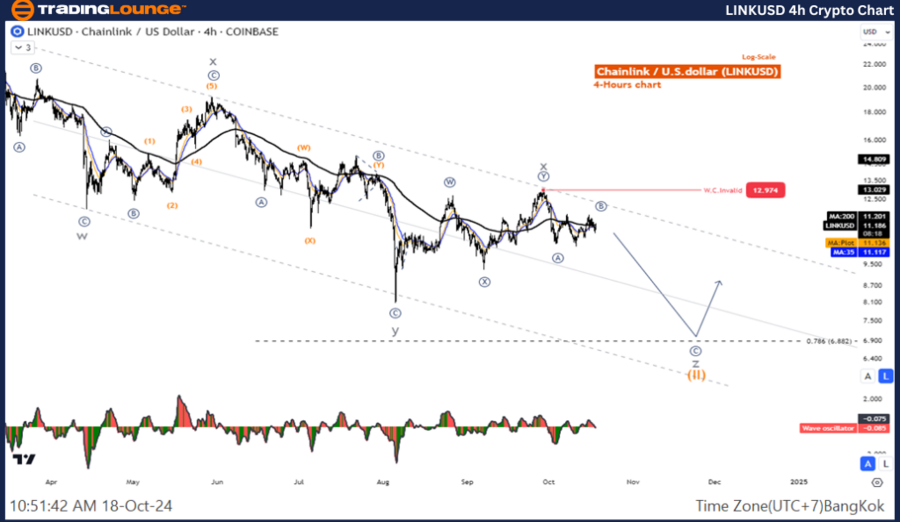
ChainLink/ U.S. Dollar (LINKUSD) TradingLounge 4-Hour Chart

LINKUSD Elliott Wave Technical Analysis

Function: Counter Trend

Mode: Corrective

Structure: Triple Corrective

Position: Wave Z

Direction Next Higher Degrees: Wave ((II)) of Impulse

Wave Cancel Invalid Level: N/A

Details: Wave (II) is expected to retest the 6.882 level.

ChainLink/ U.S. Dollar (LINKUSD) Trading Strategy

The corrective phase in Wave ((2)) appears ongoing, with a likely decline toward 6.882. This downward movement is considered a short-term pullback, and traders should watch for a return to the prevailing uptrend after this correction.

ChainLink/ U.S. Dollar (LINKUSD) Technical Indicators

  • The price is below the MA200, indicating a bearish trend.
  • The Wave Oscillator shows bullish momentum, suggesting the potential for a rebound after the corrective wave concludes.

Technical Analyst:  Kittiampon Somboonsod

Source: visit Tradinglounge.com and learn From the Experts Join TradingLounge Here See

Previous: BTCUSD Elliott Wave Technical Analysis

VALUE Offer - Buy 1 Month & Get 3 Months!Click here

Access 7 Analysts Over 200 Markets Covered. Chat Room With Support

LINKUSD-4h-Crypto-Ch...


Related

Soybeans Commodity Elliott Wave Technical Analysis: Detailing the Market Trends, and Price Forecasts

Soybeans Commodity Elliott Wave Technical Analysis: Detailing the Market Trends, and Price Forecasts

This article provides a comprehensive Elliott Wave Analysis for soybeans, detailing the market trend...

Read More >
The Coca-Cola Company (KO) Stocks Elliott Wave Technical Analysis: Detailed daily and 4-hour chart analysis

The Coca-Cola Company (KO) Stocks Elliott Wave Technical Analysis: Detailed daily and 4-hour chart analysis

Explore our comprehensive Elliott Wave analysis for The Coca-Cola Company (KO) as of July 23, 2024. ...

Read More >
ASX:SQ2 BLOCK INC Elliott Wave Analysis Reveals Bullish Breakout Structure Targeting $110, Key Support Holds Above $76.54

ASX:SQ2 BLOCK INC Elliott Wave Analysis Reveals Bullish Breakout Structure Targeting $110, Key Support Holds Above $76.54

BLOCK INC (SQ2) on the ASX is showing signs of a bullish Elliott Wave structure. A breakout above $9...

Read More >
Cardano (ADAUSD) Elliott Wave Analysis: Price Forecast, Fibonacci Levels, Trading Strategy & Wave (III) Setup

Cardano (ADAUSD) Elliott Wave Analysis: Price Forecast, Fibonacci Levels, Trading Strategy & Wave (III) Setup

Elliott Wave technical analysis of Cardano (ADAUSD), including daily and 4-hour chart breakdowns. It...

Read More >
Cardano (ADAUSD) Elliott Wave Analysis: Resistance & Support Levels, Crypto Market Trends, and Technical Analysis

Cardano (ADAUSD) Elliott Wave Analysis: Resistance & Support Levels, Crypto Market Trends, and Technical Analysis

Elliott Wave Analysis of ADA/USD, highlighting Cardano's price projections, technical analysis, ...

Read More >
KOSPI Composite Index Elliott Wave Technical Analysis shows Bullish Trend Currently on both Daily and Weekly Charts

KOSPI Composite Index Elliott Wave Technical Analysis shows Bullish Trend Currently on both Daily and Weekly Charts

The KOSPI Composite is currently in a bullish trend, supported by Elliott Wave analysis on both dail...

Read More >

$1 for 2 Weeks

then $29 a month!

What a Special Offer!

Trade Recommendations

Unleash the power of deversified trading with our comprehensive portfolio, covering 250+ markets:

  • Stock Trades
  • Crypto Trades
  • Forex Trades
  • Commodity Trades
Elliott Wave Analysis

Gain a competitive edge with expert insights and AI-powered Elliott Wave charting into:

  • Global Indices
  • US Stocks & ASX Stocks
  • Forex & Crypto
  • Commodities
Top-Notch Trading Tools

Equip yourself with the tools of success:

  • Real-time Chat rooms
  • Elliott Wave Algorithm
  • Portfolio tools
  • TradingLevels
  • Screener
  • Trading Game
7 Elliott Wave Analysts

Stay ahead of the market with daily charts and insightful videos
Your secret to strategic trading!

JOIN HERE


Welcome to TradingLounge (ASIC A.R.No. 321187), specialists in trades, trading education and technical analysis, covering stocks, indices, commodities, forex and cryptocurrencies.

When you join TradingLounge you have access to everything we offer, including trade tools, educational content and a social platform to chat with like-minded investors.

Read more

@Copyright 2024 by tradinglounge.com

Contact Us

Australian no: 02 4787 6020

International no: +61 (2) 47876020

Pay with:

Find us on