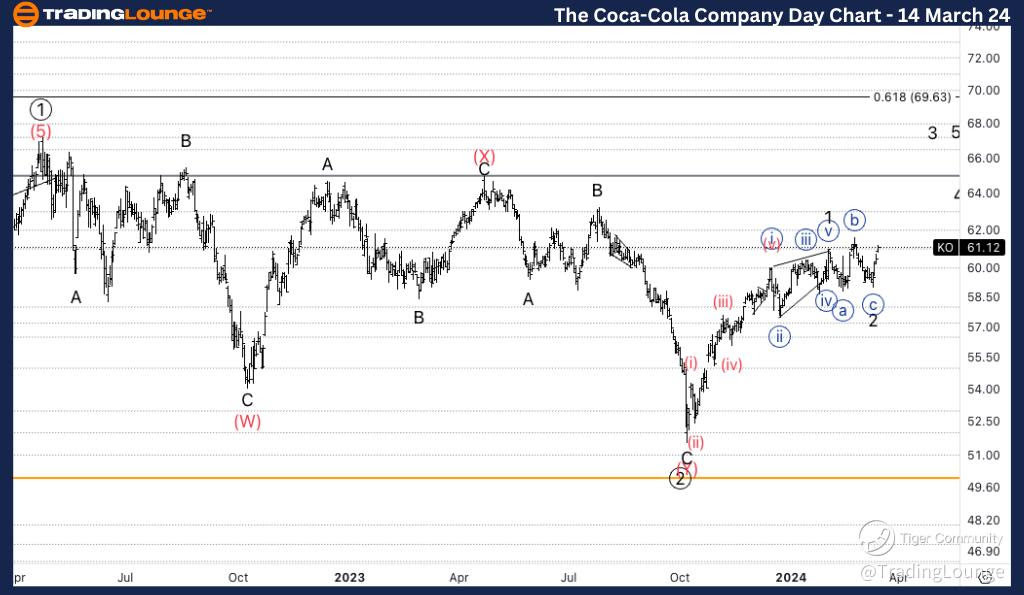
KO Elliott Wave Analysis Trading Lounge Daily Chart

In our latest Elliott Wave analysis, we delve into The Coca-Cola Company (KO) to provide comprehensive insights into its daily and 4-hour charts. Discover how Elliott Wave Theory guides our technical analysis and forecasts potential market movements. The Coca-Cola Company,  (KO) Daily Chart

KO Elliott Wave Technical Analysis

KO Daily Chart Analysis:

Function: Trend Analysis

Mode: Impulsive Trend

Structure: Motive Wave

Position: Wave (1) of Primary 3

Direction: Upside Momentum towards Wave 3 of (1)

Our analysis indicates a strong upward trend in KO's daily chart, marked by the impulsive nature of the movement. Currently positioned within Wave (1) of Primary 3, the stock shows promising potential for further bullish momentum. We anticipate a continuation of the uptrend, with Wave 3 poised for significant gains. Confirmation awaits as we await the breach of Wave (X) highs, adding strength to our forecast.

KO-Day-Stock-chart-1...


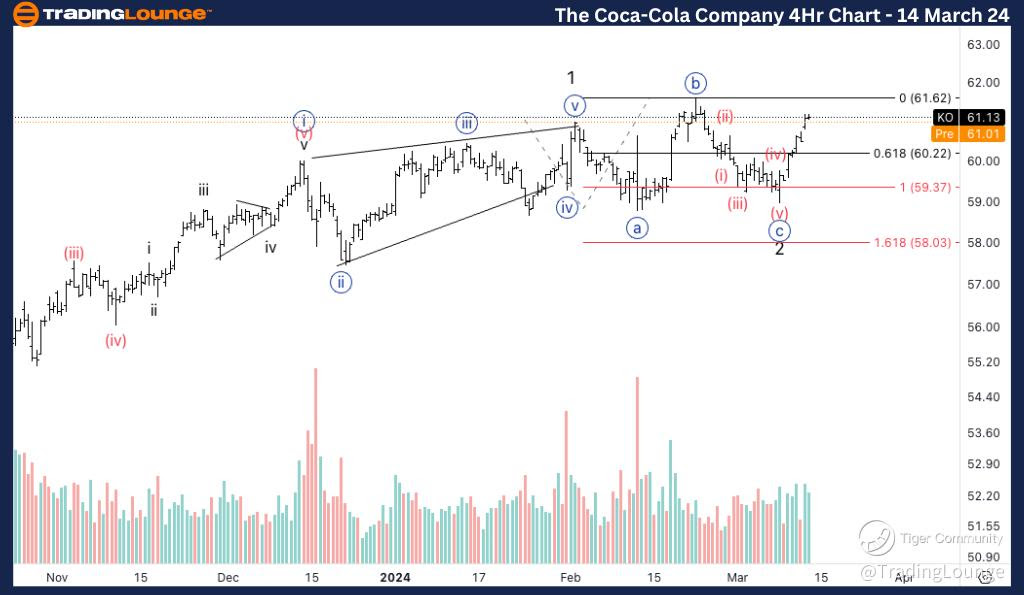
KO Elliott Wave Analysis Trading Lounge 4Hr Chart

The Coca-Cola Company, (KO) 4Hr Chart Analysis

KO Elliott Wave Technical Analysis

Function: Trend Identification

Mode: Impulsive Momentum

Structure: Motive Wave Formation

Position: Wave {i} of 3

Direction: Upward Trajectory towards Wave 3

A closer look at KO's 4-hour chart reveals a similar bullish sentiment. Wave {i} of 3 indicates the initiation of a new bullish wave cycle, with an upward trajectory anticipated. Confirmation of Wave 2 completion awaits the break of Wave {b}, bolstered by increasing volume from Wave {c} bottom. This uptick in volume solidifies the bullish case, providing additional confidence in our analysis.

In Conclusion:

Our Elliott Wave analysis of The Coca-Cola Company (KO) suggests a favourable outlook for investors. With both daily and 4-hour charts indicating impulsive bullish trends, there's potential for significant upside movement. Confirmation points, such as breaching previous highs and volume analysis, further support our optimistic forecast. Stay tuned for updates as we continue to monitor KO's market dynamics and provide actionable insights for traders.

Technical Analyst: Alessio Barretta

Source: visit Tradinglounge.com and learn From the Experts Join TradingLounge Here 

See Previous: McDonald's Corp. (MCD)

TradingLounge Once Off SPECIAL DEAL: Here > 1 month Get 3 months.

KO-4Hr-Stock-chart-1...

Related

USD/CAD Elliott Wave Analysis: Trading Insights on 4-Hour and Daily Charts - 9 February 24

USD/CAD Elliott Wave Analysis: Trading Insights on 4-Hour and Daily Charts - 9 February 24

Dated 9 February 24, our "USD/CAD Elliott Wave Analysis Trading Lounge 4 Hour Chart" sugge...

Read More >
Newmont Corporation (ASX:NEM) Elliott Wave Analysis Reveals Bullish Wave 3 Progression with $100 Target and Key Price Levels

Newmont Corporation (ASX:NEM) Elliott Wave Analysis Reveals Bullish Wave 3 Progression with $100 Target and Key Price Levels

This analysis provides an in-depth Elliott Wave forecast for Newmont Corporation (ASX:NEM), highligh...

Read More >
Larsen & Toubro Stocks Elliott Wave Technical Analysis: Understand LT Share Price targets and Market Sorecasts

Larsen & Toubro Stocks Elliott Wave Technical Analysis: Understand LT Share Price targets and Market Sorecasts

This article provides an in-depth Elliott Wave analysis for Larsen & Toubro (LT), covering daily and...

Read More >
ASX: Newmont Corporation (NEM) Elliott Wave Analysis with Bullish Targets, Invalidation Level & Technical Chart Forecast for Traders

ASX: Newmont Corporation (NEM) Elliott Wave Analysis with Bullish Targets, Invalidation Level & Technical Chart Forecast for Traders

This technical analysis offers a clear Elliott Wave forecast for ASX: NEM, detailing price targets, ...

Read More >
TCS Stock Elliott Wave Analysis Shows Bullish Impulse with Wave 1 Rising – Forecasting Higher Share Price and Trend Continuation

TCS Stock Elliott Wave Analysis Shows Bullish Impulse with Wave 1 Rising – Forecasting Higher Share Price and Trend Continuation

Detailed Elliott Wave analysis of TCS stock reveals a bullish impulsive structure on both daily and ...

Read More >
BLOCK, INC - XYZ (SQ2) Elliott Wave Analysis: Wave 2 Nears 80.00 AUD Support Zone with a Bullish Wave Forecast

BLOCK, INC - XYZ (SQ2) Elliott Wave Analysis: Wave 2 Nears 80.00 AUD Support Zone with a Bullish Wave Forecast

This analysis covers Elliott Wave patterns for ASX: BLOCK INC (SQ2), targeting the 80.00 AUD support...

Read More >

$1 for 2 Weeks

then $29 a month!

What a Special Offer!

Trade Recommendations

Unleash the power of deversified trading with our comprehensive portfolio, covering 250+ markets:

  • Stock Trades
  • Crypto Trades
  • Forex Trades
  • Commodity Trades
Elliott Wave Analysis

Gain a competitive edge with expert insights and AI-powered Elliott Wave charting into:

  • Global Indices
  • US Stocks & ASX Stocks
  • Forex & Crypto
  • Commodities
Top-Notch Trading Tools

Equip yourself with the tools of success:

  • Real-time Chat rooms
  • Elliott Wave Algorithm
  • Portfolio tools
  • TradingLevels
  • Screener
  • Trading Game
7 Elliott Wave Analysts

Stay ahead of the market with daily charts and insightful videos
Your secret to strategic trading!

JOIN HERE


Welcome to TradingLounge (ASIC A.R.No. 321187), specialists in trades, trading education and technical analysis, covering stocks, indices, commodities, forex and cryptocurrencies.

When you join TradingLounge you have access to everything we offer, including trade tools, educational content and a social platform to chat with like-minded investors.

Read more

@Copyright 2024 by tradinglounge.com

Contact Us

Australian no: 02 4787 6020

International no: +61 (2) 47876020

Pay with:

Find us on