09Jun

Polkadot DOTUSD Elliott Wave Analysis Predicts Wave III Bullish Breakout After ABC Correction and Fibonacci Level Confirmation

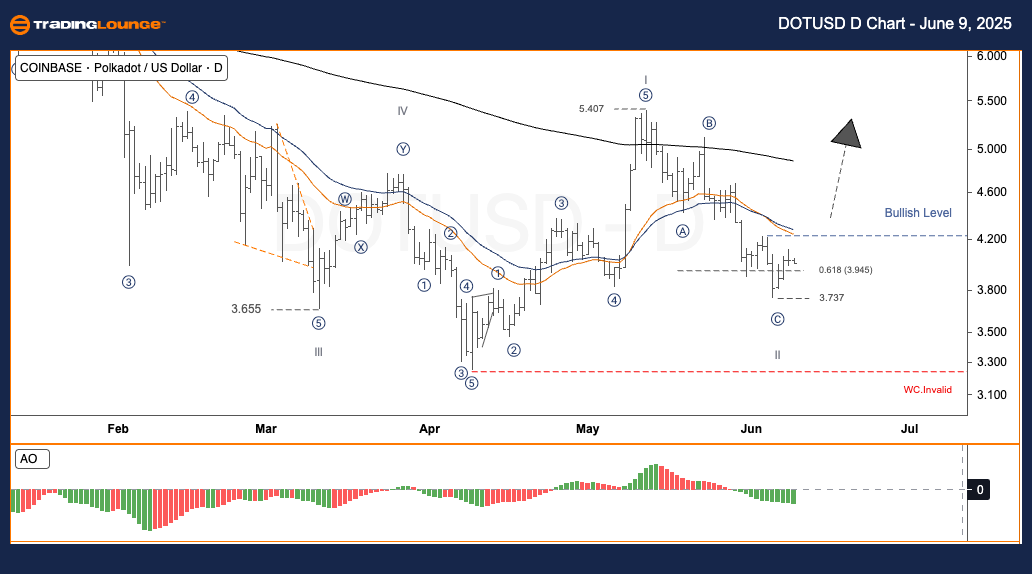
DOTUSD Elliott Wave Analysis – TradingLounge Daily Chart

Polkadot/ U.S. Dollar (DOTUSD) Daily Chart Analysis

DOTUSD Elliott Wave Technical Outlook

Function: Trend Following

Mode: Motive

Structure: Impulse

Position: Wave 2

Directions for Higher Degrees: Anticipating Wave 3

Invalidation Level: Critical breach under wave 2 support

Polkadot (DOTUSD) Daily Trading Strategy

DOTUSD completed its initial bullish phase (wave I) at a top of 5.407. It then corrected in a standard ABC formation during wave II. The wave C correction appears to have bottomed at 3.737, which closely aligns with the 0.618 Fibonacci retracement level calculated from wave I (3.945). This confluence suggests a likely start of wave III, often marked by strong bullish price action. A sustained move above the 4.40 resistance zone, referred to as the Bullish Confirmation Level, would confirm that wave II has ended and wave III has begun.

Trading Strategies
Strategy
✅ Swing Traders (Short-Term)

Entry: Initiate long positions upon a confirmed breakout above 4.40, confirming wave III.

Risk Management:

🟥 Stop Loss: Place below 3.30 to manage downside risk effectively.

DOTUSD-Day-Crypto-Ch...


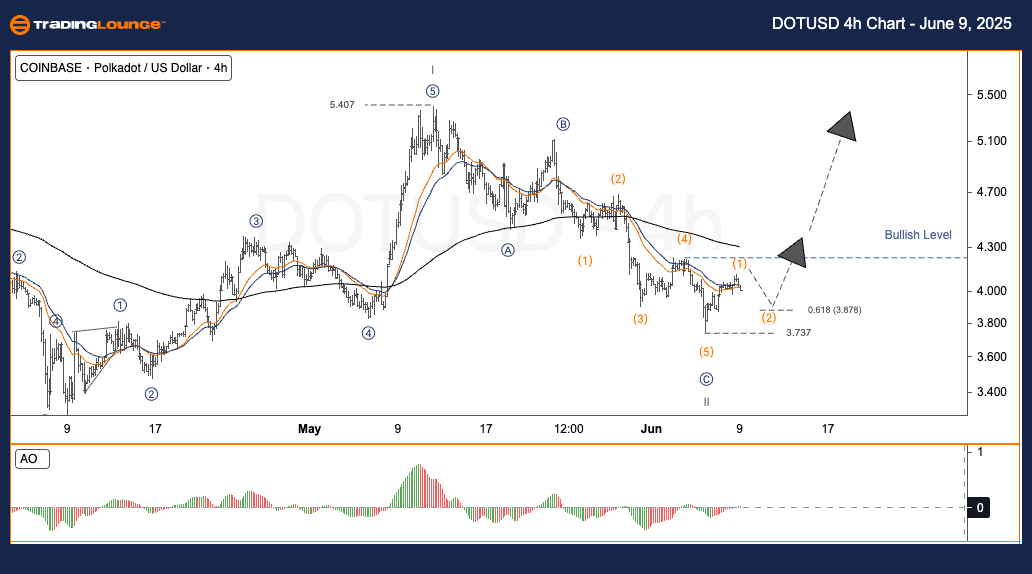
DOTUSD Elliott Wave Analysis – TradingLounge H4 Chart

Polkadot/ U.S. Dollar (DOTUSD) 4-Hour Chart Analysis

DOTUSD Elliott Wave Technical Outlook

Function: Trend Following

Mode: Motive

Structure: Impulse

Position: Wave 2

Direction for Higher Degrees: Preparing for Wave 3

Invalidation Level: Drop below wave 2 threshold

Polkadot (DOTUSD) 4-Hour Trading Strategy

DOTUSD's initial wave I surge peaked at 5.407 before reversing in a corrective ABC pattern during wave II. The final leg, wave C, likely concluded near 3.737, a level that matches the key 0.618 Fibonacci retracement of wave I at 3.945. This pattern setup suggests that the asset may now be transitioning into wave III, known for stronger price movements. A confirmed break above the 4.40 resistance mark will validate the end of wave II.

Trading Strategies

Strategy

✅ Swing Traders (Short-Term)

Entry: Only enter long trades once price action exceeds 4.40.

Risk Management:

🟥 Stop Loss: Set just below the 3.30 support level for optimal risk control.

Technical Analyst: Malik Awais

Source: Visit Tradinglounge.com and learn from the Experts. Join TradingLounge Here

Previous: SEIUSD Elliott Wave Technical Analysis

VALUE Offer - Buy 1 Month & Get 3 Months!Click here

Access 7 Analysts Over 200 Markets Covered. Chat Room With Support

DOTUSD-4H-Crypto-Cha...

Related

U.S. Dollar / Canadian Dollar (USDCAD) Elliott Wave Technical Analysis & Forecast: Wave Count Insights, Market Trends for Forex Traders

U.S. Dollar / Canadian Dollar (USDCAD) Elliott Wave Technical Analysis & Forecast: Wave Count Insights, Market Trends for Forex Traders

USDCAD Elliott Wave analysis provides an in-depth look at the current market structure, highlighting...

Read More >
ASX:SQ2 BLOCK INC Elliott Wave Analysis Reveals Bullish Breakout Structure Targeting $110, Key Support Holds Above $76.54

ASX:SQ2 BLOCK INC Elliott Wave Analysis Reveals Bullish Breakout Structure Targeting $110, Key Support Holds Above $76.54

BLOCK INC (SQ2) on the ASX is showing signs of a bullish Elliott Wave structure. A breakout above $9...

Read More >
Investing in Stocks, ETFs, or index funds: S&P 500 Index Elliott Wave Technical Analysis for Bullish and Bearish Markets

Investing in Stocks, ETFs, or index funds: S&P 500 Index Elliott Wave Technical Analysis for Bullish and Bearish Markets

Explore in-depth S&P 500 Elliott Wave analysis with a focus on trading strategies and investment tip...

Read More >
Elliott Wave Analysis for JP Morgan & Chase Co. (JPM), Focusing on Both Saily and 1-Hour Charts, Highlights Key Trading Levels

Elliott Wave Analysis for JP Morgan & Chase Co. (JPM), Focusing on Both Saily and 1-Hour Charts, Highlights Key Trading Levels

This article provides a comprehensive Elliott Wave analysis for JP Morgan & Chase Co. (JPM), focusin...

Read More >

$1 for 2 Weeks

then $29 a month!

What a Special Offer!

Trade Recommendations

Unleash the power of deversified trading with our comprehensive portfolio, covering 250+ markets:

  • Stock Trades
  • Crypto Trades
  • Forex Trades
  • Commodity Trades
Elliott Wave Analysis

Gain a competitive edge with expert insights and AI-powered Elliott Wave charting into:

  • Global Indices
  • US Stocks & ASX Stocks
  • Forex & Crypto
  • Commodities
Top-Notch Trading Tools

Equip yourself with the tools of success:

  • Real-time Chat rooms
  • Elliott Wave Algorithm
  • Portfolio tools
  • TradingLevels
  • Screener
  • Trading Game
7 Elliott Wave Analysts

Stay ahead of the market with daily charts and insightful videos
Your secret to strategic trading!

JOIN HERE


Welcome to TradingLounge (ASIC A.R.No. 321187), specialists in trades, trading education and technical analysis, covering stocks, indices, commodities, forex and cryptocurrencies.

When you join TradingLounge you have access to everything we offer, including trade tools, educational content and a social platform to chat with like-minded investors.

Read more

@Copyright 2024 by tradinglounge.com

Contact Us

Australian no: 02 4787 6020

International no: +61 (2) 47876020

Pay with:

Find us on